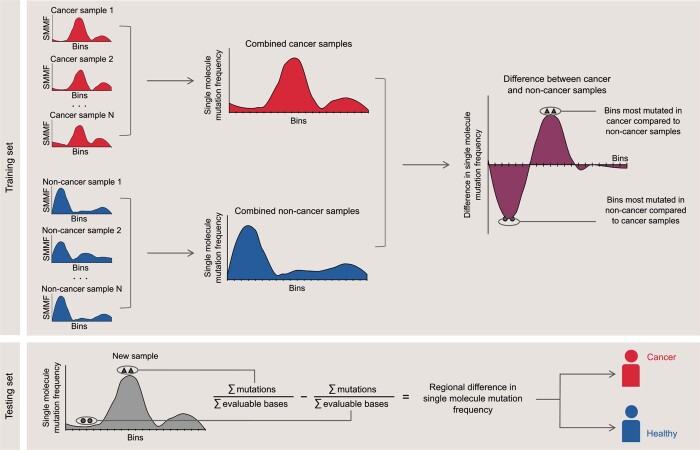
Extended Data Fig. 5. Schematic of GEMINI regional mutation frequency analysis.
The genome is divided into 1,144 non-overlapping 2.5 Mb bins (20 bins are depicted here) and the single molecule mutation frequency (SMMF) is computed in each bin as the number of sequence changes per million evaluable bases, defined as the number of positions in fragments in which each sequence change could be detected after quality and germline filtering. Samples in the training set are used to identify the bins that are most differentially mutated between cancer and non-cancer samples. In the training set, sequence data from all cancer samples and all non-cancer samples are combined, and the cancer and non-cancer single molecule mutation frequencies are computed in each bin. Next, the difference in single molecule mutation frequency is computed between cancer and non-cancer samples in each bin, and the 10% of bins most mutated in cancer samples relative to non-cancer samples, as well as the 10% of bins most mutated in non-cancer samples relative to cancer samples, are identified (indicated by triangles and circles respectively). In the testing set, the difference in single molecule mutation frequency is computed between these two sets of bins in a new sample not included in the training set, generating a regional difference in mutation frequency that can be used to classify the sample into being derived from a healthy individual or an individual with cancer. By taking the difference in single molecule mutation frequency between two sets of regions in the genome within an individual sample, this approach controls for the overall number of sequence changes in that sample that may result from technical variability in sequencing runs.

