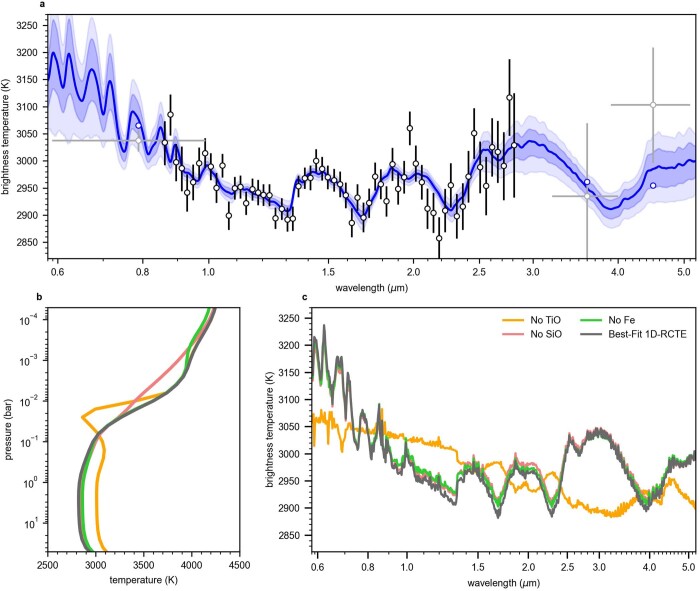
Extended Data Fig. 6. WASP-18b’s brightness temperature spectrum fit and source of the thermal inversion.
a, The dark blue line indicates the chemical-equilibrium median fit to the NIRISS data with its 1σ error bars (black points), with shaded blue regions showing the 1σ and 2σ credible intervals in the retrieved spectrum (medium and light blue, respectively). The spectra are extrapolated to the TESS (visible wavelengths) and the Spitzer/IRAC measurements (3.6 and 4.5 μm) observations (grey points) considering the same atmospheric parameters. b, Best-fit radiative–convective model temperature–pressure profile together with radiative–convective solutions in which specific species known to create a thermal inversion are removed from the atmosphere. Absorption by atomic iron contributes to the thermal inversion at pressures lower than 1.0 millibar, whereas TiO is responsible for the thermal inversion seen between 0.1 and 0.01 bar. SiO contributes at pressures lower than 0.1 bar. c, Best-fit radiative–convective brightness temperature spectrum (excluding area fraction) and resulting spectra when removing specific species. As shown by the change from emission to absorption features in the spectra when TiO is removed, the TiO-induced thermal inversion is that examined by our observations.

