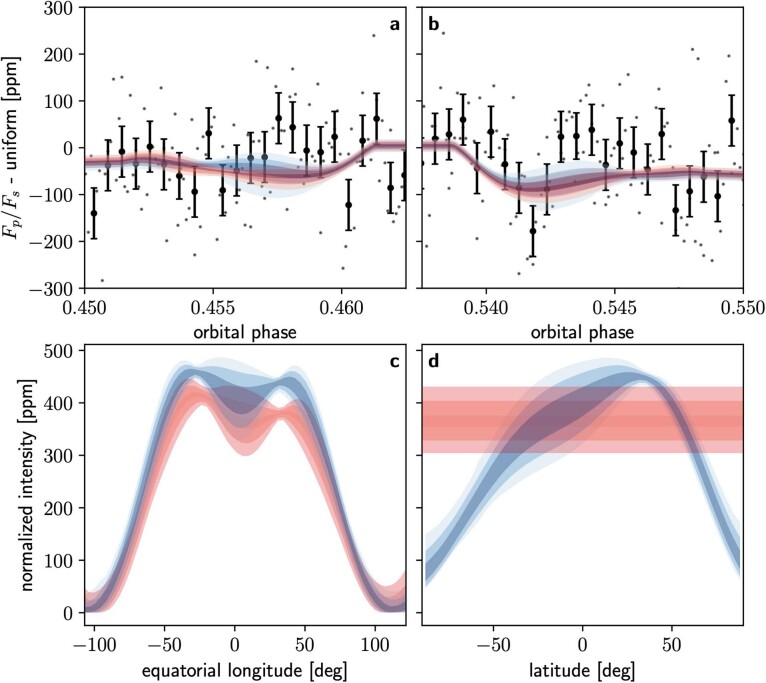
Extended Data Fig. 9. Latitudinal structure in the eclipse map.
a, Ingress of the eclipse, with two models overplotted and a 1,096 ppm (white-light planet flux at mid-eclipse) uniform planet model subtracted to highlight deviations. The data (small dots) have been binned by a factor of five (dots with 1σ error bars) for clarity. The blue model is the eclipse map for lmax = 5, N = 5 presented in the text. The red model uses a constant-with-latitude Fourier series as the basis set, rather than spherical harmonics, to investigate constraints on latitudinal aspects of the map. Shaded regions denote 1σ, 2σ and 3σ quantiles. b, Same as a but for the eclipse egress. c, Planetary flux along the equator for the same two models. Note that, regardless of basis functions, we retrieve the same longitudinal structure, giving us confidence in the longitudinal brightness distribution. d, Same as c but along the substellar meridian. Both models fit the data well but find different latitudinal structure, indicating that we are unable to constrain latitudinal variation.

