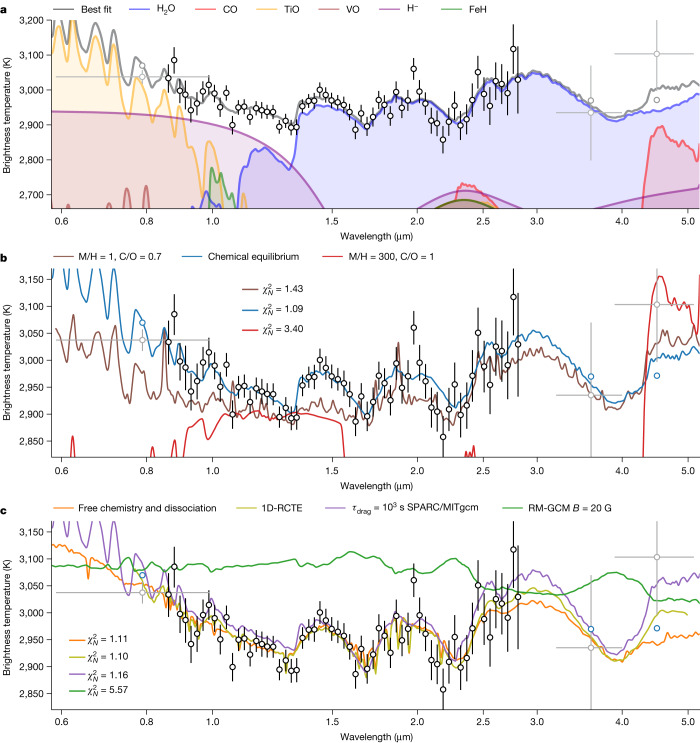
Fig. 2. Brightness temperature spectrum of WASP-18b.
a, Brightness temperature of WASP-18b as a function of wavelength, with models extrapolated to the TESS and Spitzer points considering the same atmospheric parameters. All data are plotted with their 1σ error bars. The H2O emission features at 1.4, 1.9 and 2.5 μm are clearly visible. The increase in brightness temperature observed in the water features is indicative of a thermal inversion. We also observe a downward slope in the spectrum from 0.8 to 1.3 μm as the opacities of H−, TiO and VO decrease. We find that the precision of the observations at 2.4 μm is not sufficient to detect the small expected contribution from CO. b, Comparison of the high metallicity and C/O case4 (red), as well as the solar metallicity case with H− opacity and H2O dissociation7 (brown, best fit to the HST data shown in Fig. 1) that could both explain the past HST observations. We also show the SCARLET best-fit model to the NIRISS observations (blue). c, Median fits of the free-chemistry retrieval (orange) and of the self-consistent chemical-equilibrium grid retrieval (green). We also show the dayside spectra obtained by post-processing the SPARC/MITgcm (purple) and RM-GCM (green) for a drag timescale of τdrag = 103 s and a magnetic field strength of B = 20 G, respectively. We find that the SPARC/MITgcm better reproduces the observed features, as the RM-GCM is more isothermal.

