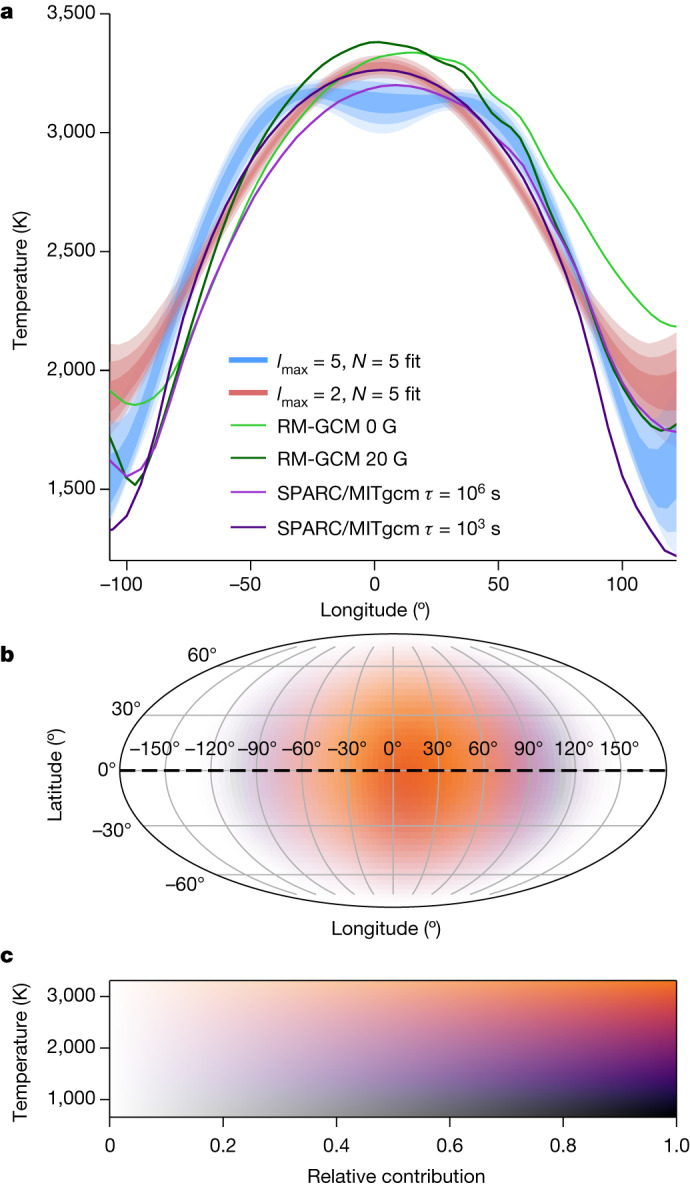
Fig. 4. Retrieved temperature map of WASP-18b.

a, Latitudinally averaged brightness temperatures (see Methods) of the planet along the equator. The blue and red shaded areas show solutions for lmax = 5, N = 5 and lmax = 2, N = 5 (see Methods), respectively. The effective broadband wavelength of the map, weighted by the observed flux (Fp + Fs) and instrument response, is λ = 1.27 μm. Statistically, the blue model is marginally preferred. Dark, medium and light shading denote the 1σ, 2σ and 3σ confidence regions, respectively, showing the range of model possibilities. Overplotted are several predictions from GCMs with magnetic field52 (green) or uniform53 (purple) drag timescales (see Methods). The plot only shows longitudes emitting at least 10% of the substellar flux. b, The temperature map of WASP-18b for the lmax = 5, N = 5 solution. Along the equator at −90°, 0° and 90° longitude, the temperatures are 1,744 K, 3,121 K and 2,009 K, respectively. c, The colour bar for the map shown in b. Colour represents the brightness temperature and saturation represents the relative contribution to the light curve based on its visibility.
