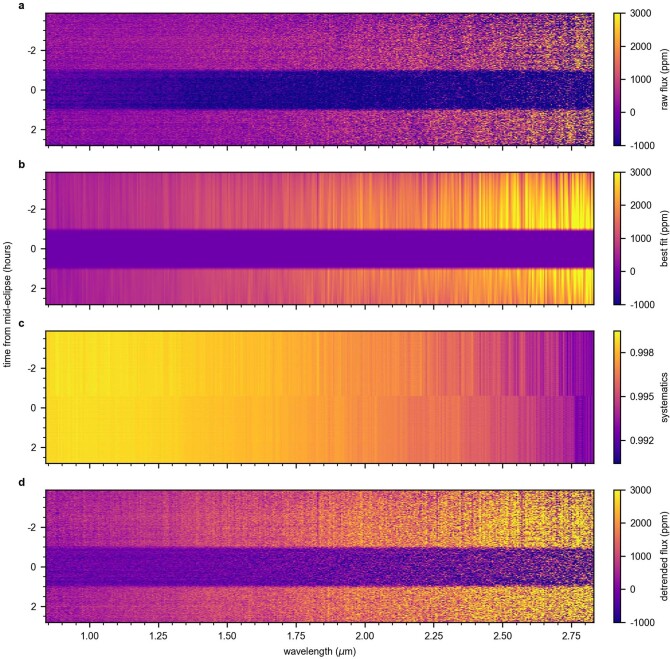
Extended Data Fig. 1. Spectrophotometric secondary-eclipse light curves of WASP-18b.
a, Raw light curves for all 408 spectrophotometric bins. b, Best-fit planetary flux measured from the light-curve fits. c, Systematics subtracted from a, consisting of a linear trend and the detrending against the tilt event and the trace morphology changes. The jump around 0.7 h before mid-eclipse comes from the fit of the flux offset caused by the tilt event. d, Raw light curves after subtraction of the best-fit systematics model. Some of the detrended light curves show sudden flux variations between wavelength bins outside of eclipse caused by correlations between the astrophysical and systematics models. Those correlations are, however, considered when computing the spectrum, as the Fp/Fs values are marginalized over the range of systematics model that fit the light curves.

