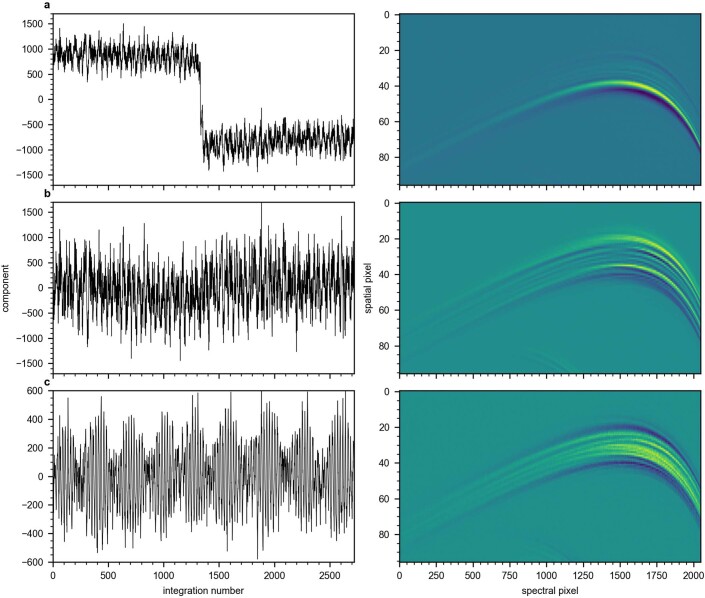
Extended Data Fig. 2. Morphological changes of the spectral trace on the NIRISS detector as identified through PCA on the time series of the detector images.
a, First principal component with its eigenvalues (left) and its corresponding eigenimage (right). The tilt event occurring near the 1,336th integration can clearly be identified as the largest source of variance to the detector images. It results in a subtle change to the trace profile in the cross-dispersion direction, predominantly visible near its lower edge of the trace. b, Second principal component with its eigenvalues (left) and its corresponding eigenimage (right). The second principal component represents subtle changes in the y position of the trace throughout the time series, with the two edges of the trace trading flux. c, Third principal component with its eigenvalues (left) and its corresponding eigenimage (right). The third component represents changes in the FWHM of the trace and shows a clear beat pattern in time. The eigenimage for this component shows a trade of flux between the centre and the edges of the trace throughout the time series.

