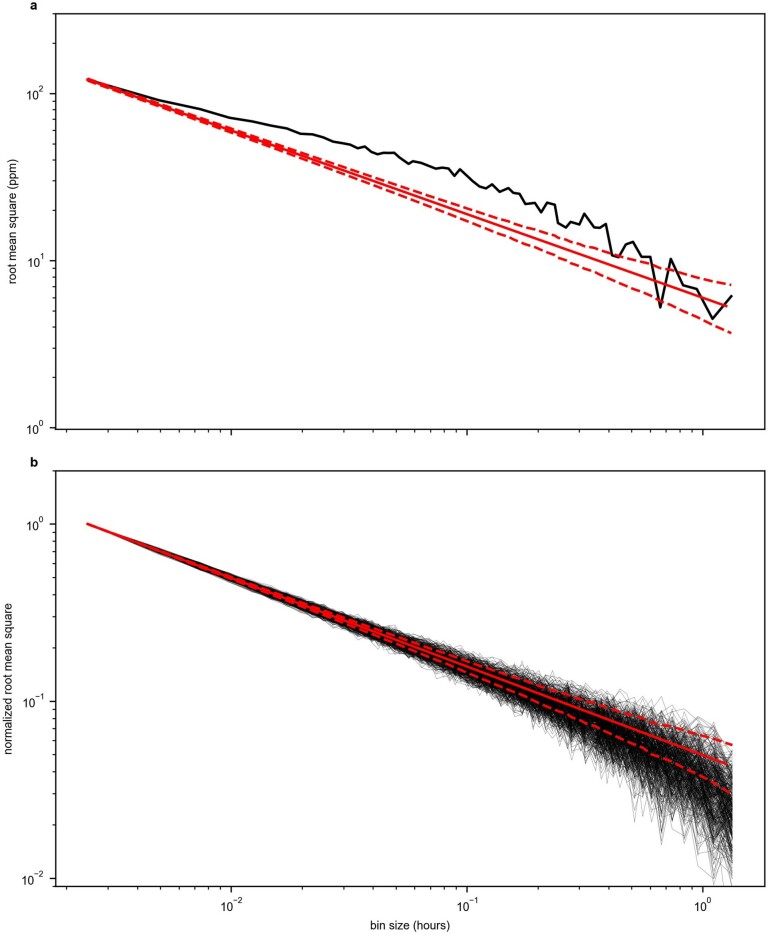
Extended Data Fig. 4. Light-curve residuals binned in time.
a, Absolute root mean square (RMS) of the residuals as a function of bin size (black line) for the white-light curve. The RMS values are plotted against the Poisson noise limit (red line), which decreases as the square root of the number of integrations contained in a single bin. We also show the theoretical 1σ error envelope of the Poisson noise. The residuals bin down to about 5 ppm for bins of 1 h and show no evidence of a noise floor, similar to what was observed from commissioning data54. The broadband residuals do not perfectly follow the Poisson noise, which is indicative of remaining time correlations. b, Normalized RMS of the 408 spectrophotometric light curves considered in the analysis. We observe that the residuals follow the Poisson noise limit from bin sizes of a single integration up to bins of approximately 1 h, indicating that there are no time correlations in the residuals. We observe a slight decrease of the normalized RMS below the Poisson noise at larger bin sizes, similar to what was observed in the NIRCam and NIRSpec/G395H observations of WASP-39b (refs. 21,165).

