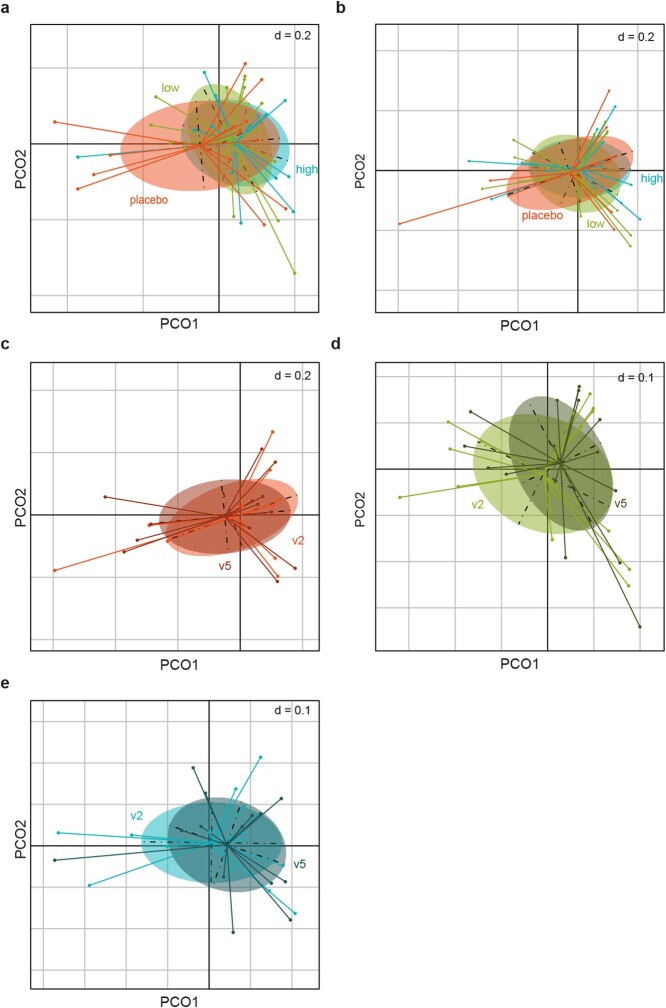
Extended Data Fig. 7. Analysis of overall fecal microbiota composition in the healthy volunteers after administration of D. piger DSM 32187 and F. prausnitzii DSM 32379 for 8 weeks.
Principal coordinate analysis for the Bray-Curtis dissimilarity calculated based on species abundances for: a, fecal samples at baseline (r2 = 0.018; p = 1; adonis); b, fecal samples at the end of the administration (r2 = 0.040; p = 0.660; adonis); c, fecal samples from the placebo group at baseline (v2) and at the end of the administration (v5) (r2 = 0.009; p = 0.997; adonis); d, fecal samples from the low dose group at baseline (v2) and at the end of the administration (v5) (r2 = 0.014; p=0.971; adonis); e, fecal samples from the high dose group at baseline (v2) and at the end of the administration (v5) (r2 = 0.001; p = 0.996; adonis). Differences in composition were tested by a permutational multivariate ANOVA using the adonis2 function with 10,000 permutations in the vegan package in R (https://github.com/vegandevs/vegan/). Adjustments for multiple comparisons were made. The dots in the plots indicate fecal samples the 43 individuals with metagenomic data: placebo, n = 13; low dose, n = 16; high dose, n = 14. The analyses show no difference in microbiota composition among the groups at baseline or at the end of the administration (panels a and b, respectively), and no difference at the end of the administration compared to baseline in any of the groups (panels c, d and e).

