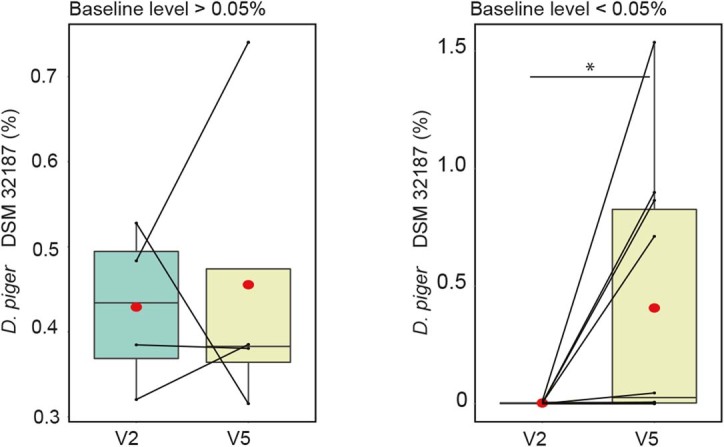
Extended Data Fig. 8. Genome capture for the abundance of F. prausnitzii DSM 32186 and D. piger DSM 32187 in fecal samples from the high dose group.

Change in relative abundance in samples with high baseline D. piger DSM 32187 (> 0.05% of total microbiota; n = 4, p = 0.875, two-sided Wilcoxon signed-rank test) and low baseline D.piger DSM 32187 (<0.05% of total microbiota; n = 10, p = 0.042, Wilcoxon signed-rank test). v2, fecal samples at baseline; v5, fecal sample at the end of the administration. For box plots the middle line is the median, the lower and upper hinges are the first and third quartiles, the whiskers extend from the hinge to the largest and smallest value no further than 1.5 × the inter-quartile range (IQR).
