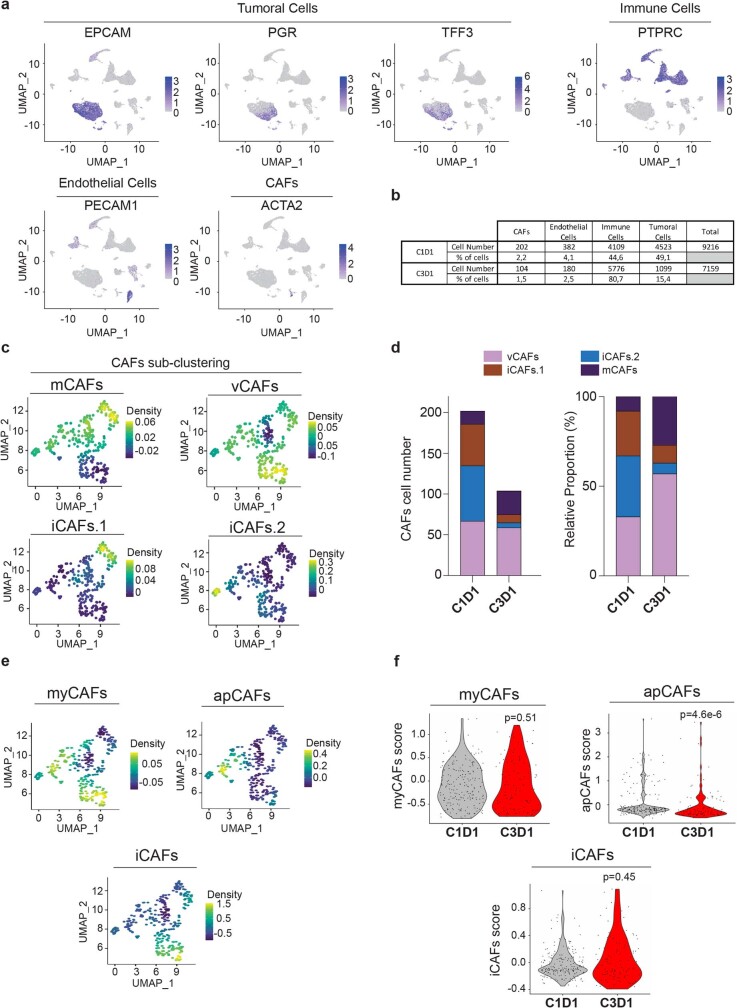
Extended Data Fig. 4. Pre/post biopsies scRNAseq identify global cell types and cancer cell sub-clustering.
a, UMAP plot with the 2 integrated samples of patient 01-040 showing the normalized expression of major cell type markers: immune cells (PTPRC, also known as CD45), endothelial cells (PECAM), tumor cells (EPCAM, PGR, TFF3), CAF cells (ACTA2). b, Table showing the cell number in each cell type. c, Identification of CAFs subtypes (markers used: mCAFs: MMP2, DCN, COL12A1, FBLN1; vCAFs : MCAM, COL4A1, COL18A1; iCAFs.1: MUSTN1, TAGLN, S100A4, CXCL2; iCAFs.2: S100A8, CXCL8, SPLI). d, CAFs subcluster composition analysis, the left panel shows the total CAFs numbers per cluster in each condition and the right panel shows the proportion of CAFs per cluster in each samples. e, UMAP plot of sub-clustered CAFs showing other CAFs subtypes (markers used: myCAFs: ACTA2, CTGF, POSTN, PDGFR, TGFB1, COL1; iCAFs : IL6, CXCL1, CCL2, PDGFRA, HAS1, FAP, IL11, LIF; apCAFs: H2-AB1, CD74, SAA3). f, Violin plot showing CAFs subtypes scores before and after treatment (C1D1 or C3D1) (Wilcoxon test, two-sided).

