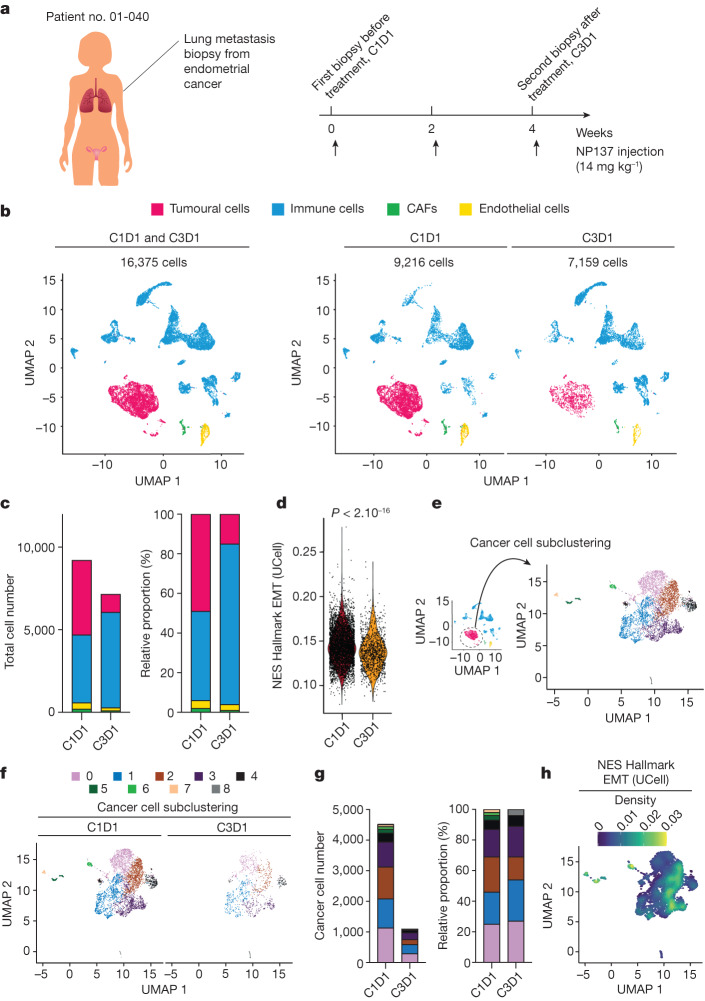
Fig. 5. Single-cell RNA-seq analysis pre and post biopsy of a patient with EC.
a, Illustration of patient no. 01-040 with two lung metastasis biopsies—one before treatment (C1D1), and one after two cycles of NP137 treatment (C3D1). b, Uniform manifold approximation and projection (UMAP) plot of 16,375 cells from two lung metastasis biopsies (left) or before treatment with 9,216 cells (C1D1, middle) and after treatment with 7,159 cells (C3D1, right), coloured by their four major cell types. c, Composition of major cell types in C1D1 and C3D1 biopsies. Left, total cell numbers in each condition; right, proportion of cells in each sample (note that cancer cell number decreased markedly after treatment). Colour coding as in b. d, Violin plot of EMT UCell enrichment score between cells of C1D1 and C3D1 biopsy (two-sided Wilcoxon test, P < 2.10−16). e, UMAP plot of subclustered cancer cells from the whole integrated dataset (C1D1 + C3D1). f, UMAP plot of subclustered cancer cells before and after treatment. g, Composition of cancer cell clusters in C1D1 and C3D1 biopsies. Left, cell numbers; right, proportion of cells in each sample (note that cancer cell number decreased markedly after treatment). h, Density plot of EMT UCell enrichment score showing clusters 2/3 with strong EMT enrichment (note that cluster 2 decreased after treatment (g, right)).

