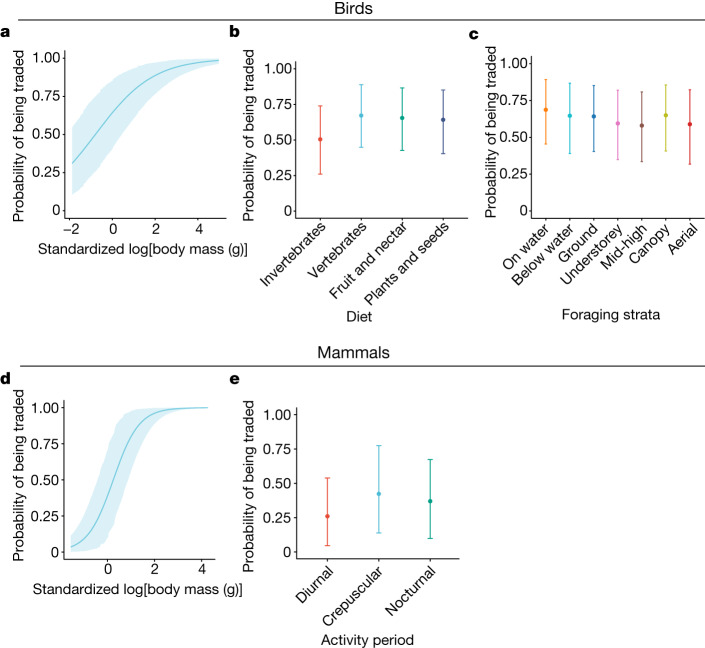
Fig. 4. Probability of a species presence in trade across functional traits for birds and mammals.
a–c, Birds. d,e, Mammals. a–e, Effect of standardized body mass (grams, log transformed (a,d)), avian diet (b), avian foraging strata (c) and mammalian activity period (e). Points (or line for body mass) represent median draw from the posterior. Confidence intervals represent the upper and lower 90% credible intervals. Draws from the posterior for a given trait were taken with all other traits set at the mean value for each respective taxonomic group. Birds, diet denotes plants and seeds; foraging strata denotes ground; activity period denotes not nocturnal; standardized body mass is 0; mammals, diet denotes plants and seeds; foraging strata denotes ground; activity period denotes nocturnal; standardized body mass is 0.

