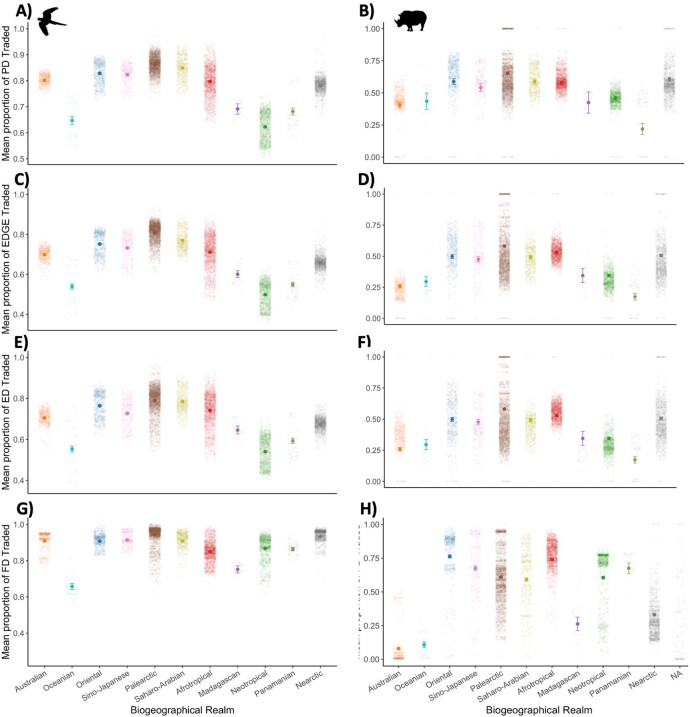
Extended Data Fig. 2. The mean proportion of each metric traded for birds and mammals between biogeographic realms.
Beta regressions were used to determine whether the proportion of each metric traded differed by biogeographic realm for (A,C,E,G) birds and (B,D,F,H) mammals. (A and B) Phylogenetic Diversity- Birds: Pseudo R-squared= 0.3577, Log likelihood= 16240, df= 12, p < 0.05; Mammals: Pseudo R-squared= 0.1586; Log Likelihood 6776, df = 12, p < 0.05. (C and D) Summed Evolutionary Distinctiveness and Global Endangerment score- Birds: Pseudo R-squared= 0.3772, Log- likelihood= 12910, df= 12, p < 0.05; Mammals: Pseudo R-squared= 0.2189, Log-likelihood= 5551, df= 12, p < 0.05. (E and F) Summed Evolutionary Distinctiveness- - Birds: Pseudo R-squared= 0.2569, Log likelihood= 11880, df= 12, p < 0.05; Mammals: Pseudo R-squared= 0.1871, Log likelihood= 4685, df= 12, p < 0.05. (G and H) Functional Richness- Birds: Pseudo R-squared= 0.1902, Log-likelihood= 17880, df= 12, p < 0.05; Mammals: Pseudo R-squared= 0.5406, Log-likelihood= 5040, df= 12, p < 0.05.) Error bars represent 95% confidence intervals. Transparent points behind the means are the raw proportions of each grid cell. Biogeographic realms are colour coded.

