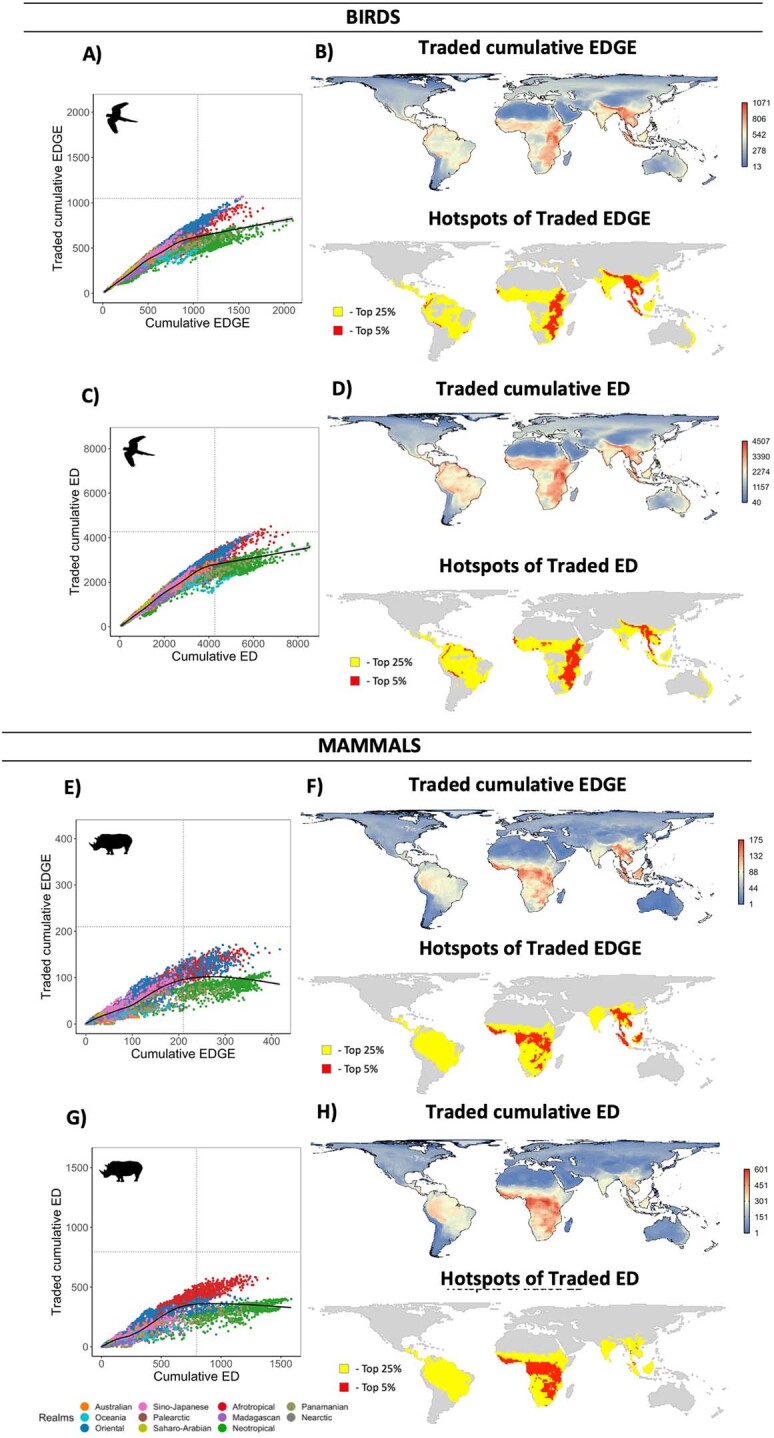
Extended Data Fig. 5. Maps and scatterplots of cumulative ED and EDGE.

(A) and (E) cumulative ED and (C) and (G) cumulative EDGE for birds and mammals, respectively. (B), (D), (F) and (H) show the maps and hotspots of each measure. Cells highlighted as yellow representing the top 25% of grid cells, and those in red representing the top 5%. (A), (C), (E) and (G) show the relationship between the summed values of just traded species and the summed values of all species. Cells are colour coded by biogeographic realm. The black lines in scatterplots indicate a locally estimated scatterplot smoothing (LOESS) fit.
