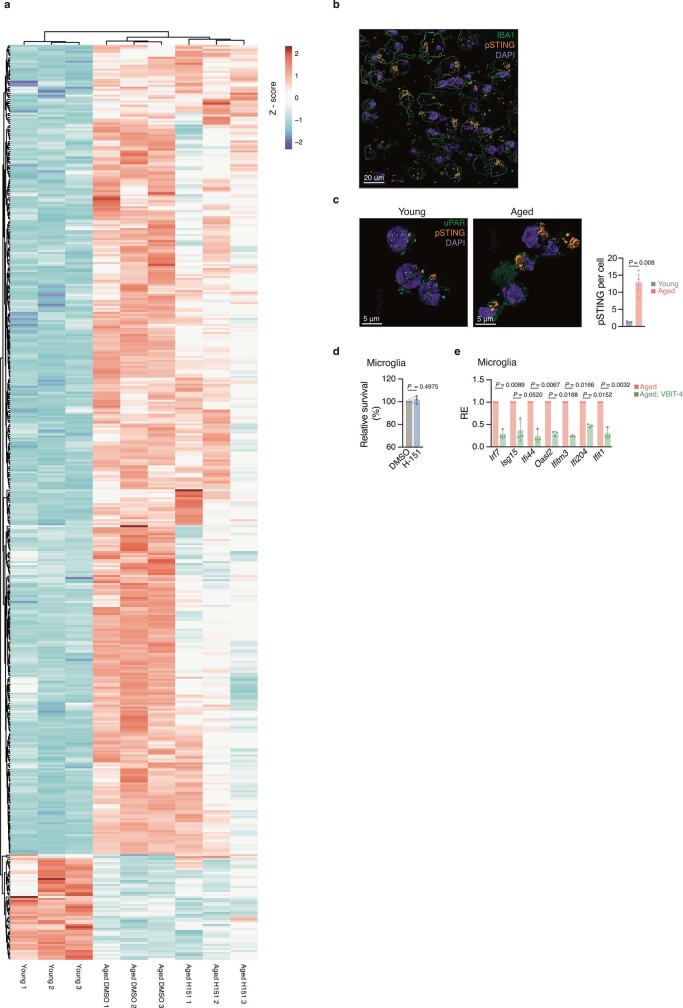
Extended Data Fig. 6. STING-dependent effects in aged microglia.
a, Heatmap depicting aging responsive genes (459 genes, FDR ≤ 0.01, Log2FC ≥ 0.6 n = 3 per condition). Colours are representative of normalized counts per million. Genes and samples are ordered by unsupervised clustering. b, Representative confocal image of pSTING staining in aged hippocampi sections (n = 1, represents n = 4 mice). Scale bar, 20 μm. c, Representative confocal images and quantification of pSTING foci in microglia cultured from young and aged mice (average from 20 cells per mouse, n = 3). Scale bars, 5 μm. d, Relative survival of primary microglia treated with H-151 for 24 h, measured by Cell titre blue (CTB) assay (n = 3 mice). e, mRNA expression levels of immunoreactive and interferon-stimulated genes in primary microglia from aged mice treated or not VBIT-4 (10 μm) for 4 days (n = 3). Data are mean ± s.e.m. P values were calculated by two-sided Student’s unpaired (c,d) or two-sided Student’s paired (e) t-test. uPAR, urokinase-type plasminogen activator receptor.

