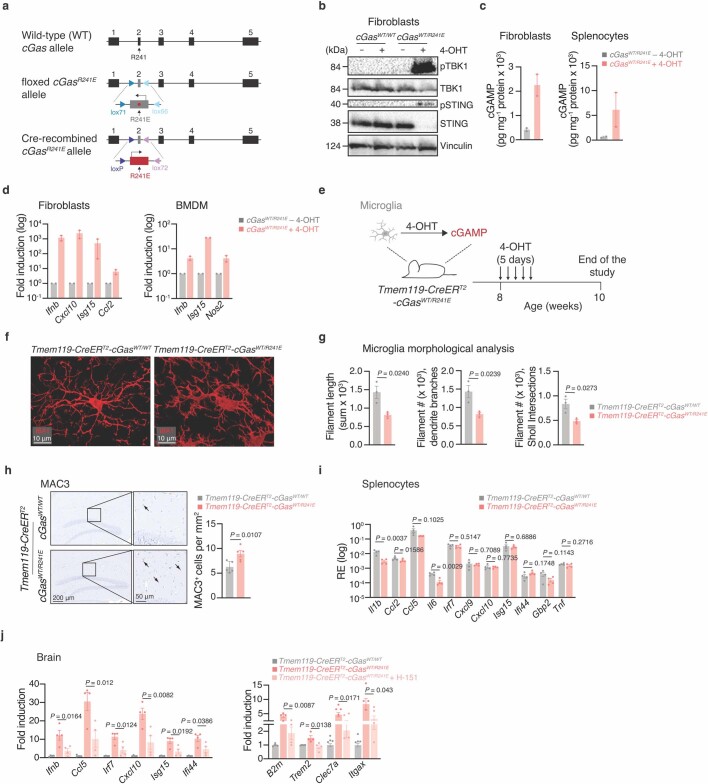
Extended Data Fig. 8. Genetic activation of cGAS-STING signalling in diverse cells of cGasR241E mice in vitro and in vivo.
a, Schematic illustrating the knock-in cGAS gain-of-function mouse model. b, Western blot analysis of cGAS activation in tail-tip fibroblasts of Rosa26-creERT2-cGasWT/WT and Rosa26-creERT2-cGasWT/R241E mice, treated or not with 4-OHT. c, cGAMP levels in cell lysates of tail-tip fibroblasts and splenocytes from Rosa26-creERT2-cGasWT/WT and Rosa26-creERT2-cGasWT/R241E mice (n = 2). d, mRNA expression levels of interferon-stimulated genes in tail-tip fibroblasts and bone-marrow-derived macrophages (BMDM) from Rosa26-creERT2-cGasWT/R241E mice (n = 2), 4-OHT-treated or not. e, Experimental set-up for the analysis of microglia-specific cGAS activation. f, g, IBA1+ microglia analysis from Tmem119-creERT2-cGasWT/WT and Tmem119-creERT2-cGasWT/R241E mice by IMARIS, showing raw images pre-reconstruction (f) and morphological analysis (g), with image-based quantification (n = 3 mice). h, Representative images and quantification of hippocampal MAC3 in brain sections of Tmem119-creERT2-cGasWT/WT or Tmem119-creERT2-cGasWT/R241E mice (n = 5). i, mRNA expression levels of proinflammatory and interferon-stimulated genes in splenocytes of Tmem119-creERT2-cGasWT/WT and Tmem119-creERT2-cGasWT/R241E mice treated with 4-OHT (n = 4). j, Brain mRNA expression levels of proinflammatory and interferon-stimulated genes (left) and microglia activation markers (right) from Tmem119-creERT2-cGasWT/WT and Tmem119-creERT2-cGasWT/R241E mice 4-OHT-treated, and additionally with H-151 or not (n = 4). Data are mean ± s.e.m. P values were obtained with two-sided Student’s unpaired t-test (g-i) or one-way ANOVA followed by Tukey’s multiple comparisons tests (j). RE, relative expression.

