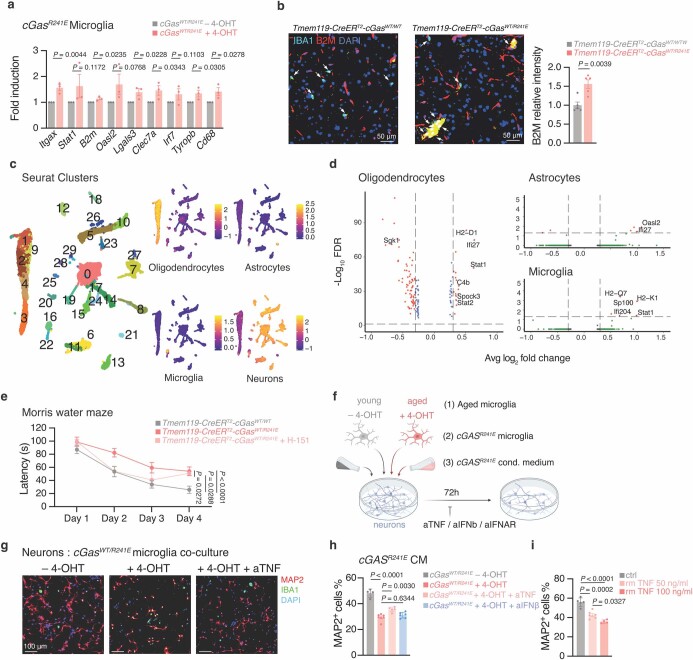
Extended Data Fig. 10. Effects of cGAS-activated microglia on brain cells.
a, mRNA expression levels of interferon-stimulated genes and activation markers in microglia from Tmem119-creERT2-cGasWT/R241E mice 4-OHT-treated or not (n = 3). b, Representative images and quantification of IBA1+ microglia B2M intensity from brain sections of Tmem119-creERT2-cGasWT/WT and Tmem119-creERT2-cGasWT/R241E mice (averaged per mouse, n = 5, from 10–15 cells). Arrows indicate IBA+ microglia. Scale bars, 50 μm. c, UMAP plots of sorted hippocampi nuclei’s unsupervised clustering (38 clusters) with identified oligodendrocytes-, astrocyte-, microglia- and neuron-specific gene expression scores. d, Volcano plots of genes differentially expressed between Tmem119-creERT2-cGASWT/WT and Tmem119-creERT2-cGASWT/R241E mice (n = 4) in oligodendrocytes, astrocyte, and microglia MG (FDR ≤ 0.05, Log2FC ≥ 0.3, genes listed in Supplementary Table 6). e, Morris water maze memory test of Tmem119-creERT2-cGasWT/WT (n = 6) and Tmem119-creERT2-cGasWT/R241E mice (data in Fig. 4h), additionally H-151-treated (n = 5) or not (n = 11), P = 1 × 10⁻⁵. f, Schematic illustrating neuronal cell co-culture experiments. g, Representative images of neurons (MAP2, red) cultured with microglia from Rosa26-creERT2-cGasWT/R241E mice (IBA1, green), 4-OHT-treated or not, and aTNF (represents n = 3 experiments). Scale bars, 100 μm. h, Relative survival of MAP2+ neurons cultured with conditioned medium from Rosa26-creERT2-cGasWT/R241E-isolated macrophages, 4-OHT-treated (n = 6 FOV) or not (n = 4 FOV), and with aTNF (n = 5 FOV), aIFNb (n = 6 FOV, from n = 3 mice) addition, P = 3 × 10⁻⁹. i, Relative survival of MAP2+ neurons treated with increasing doses of recombinant TNF (untreated n = 5, 50 ng/ml n = 5, 100 ng/ml n = 4 FOV), from 3 slides per condition, P = 1 × 10⁻⁵. Data are mean ± s.e.m. P values were obtained by one-sided (a) or two-sided (b) unpaired Student’s t-test, one-way ANOVA followed by Tukey’s multiple comparisons tests (h,i) or two-way ANOVA (e).

