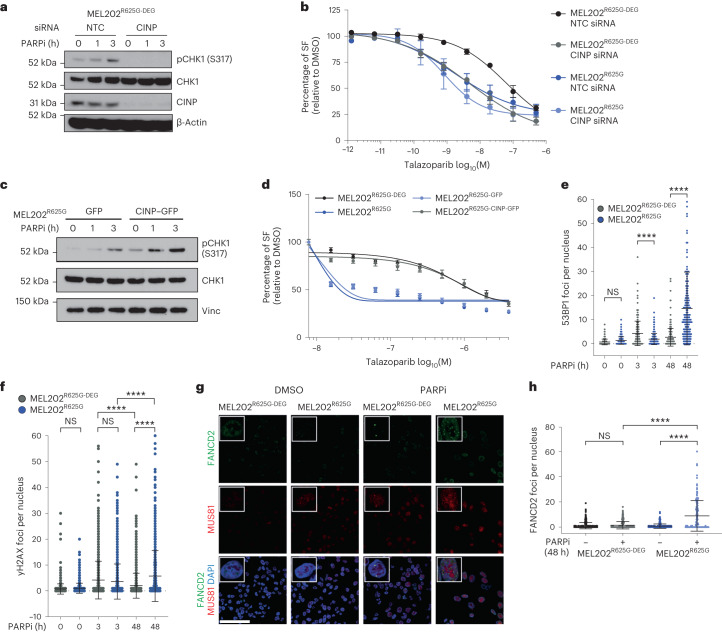
Fig. 4. A defective replication stress response leads to PARPi sensitivity in SF3B1MUT cells.
a, Western blot of pCHK1 (S317), total CHK1 and CINP expression in MEL202R625G-DEG cells after non-targeting control (NTC) or CINP siRNA-mediated gene silencing, with 0, 1 or 3 h of 500 nM talazoparib exposure. Images are representative of n = 3 biological replicates. b, Talazoparib dose–response curves showing the SF, relative to DMSO, of MEL202 isogenic cells after NTC or CINP siRNA-mediated gene silencing. Data are mean of three replicates, error bars show ±s.e.m. c, Western blot of pCHK1 (S317) and total CHK1 expression in MEL202R625G cells expressing control–GFP or CINP–GFP, following 0, 1 and 3 h of 500 nM talazoparib exposure. Images are representative of two biological replicates. d, Talazoparib dose–response curves showing the SF, relative to DMSO, of MEL202 isogenic cells, and MEL202R625G cells expressing control–GFP or CINP–GFP. Data are mean of n = 3 biological replicates, error bars show ±s.e.m. e,f, Scatterplots showing the number of 53BP1 (e) and γH2AX (f) foci per nucleus in MEL202 isogenic cells after 0, 3 h (500 nM) and 48 h (50 nM) talazoparib exposure. Data are representative of n = 3 biological replicates, error bars show ±s.d. g,h, Representative immunofluorescence images (g) of FANCD2 and MUS81 foci and scatterplot of FANCD2 foci (h) in MEL202 isogenic cells after 48 h DMSO or (50 nM) talazoparib exposure. Scale bar, 100 μm. Data are representative of n = 3 biological replicates, error bars show ±s.d. of individual nuclei assessed. P values are calculated by one-way ANOVA (e, f and h), ****P < 0.0001. NTC, nontargeting control; NS, not significant.

