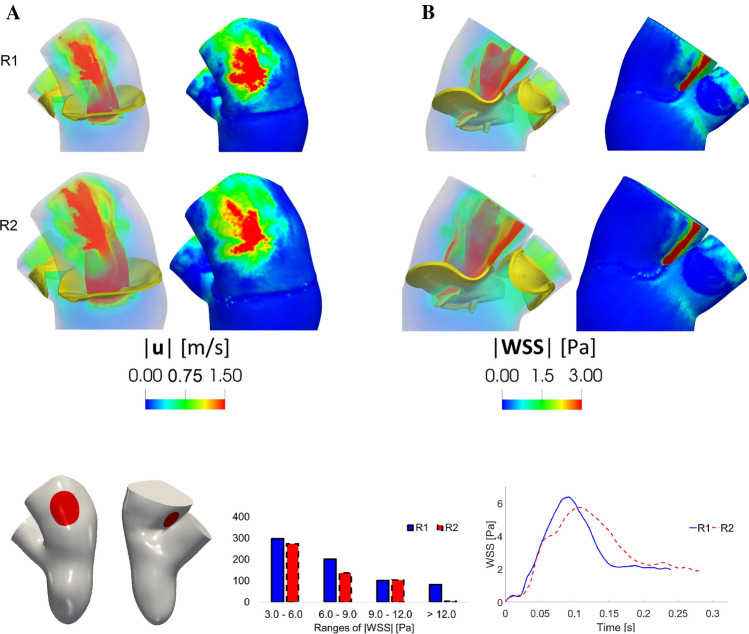
Fig. 11.
Top: for each of the columns A and B: volume rendering of the velocity magnitude (left) and spatial distribution of the WSS magnitude (right). Time . Bottom, left: in red the selected regions with the points used to compute the histogram and the plot on the right. Bottom, middle: distribution of the WSS magnitude acting on the red regions at . Bottom, right: trend in time of the average (in space) of the WSS magnitude acting on the red regions

