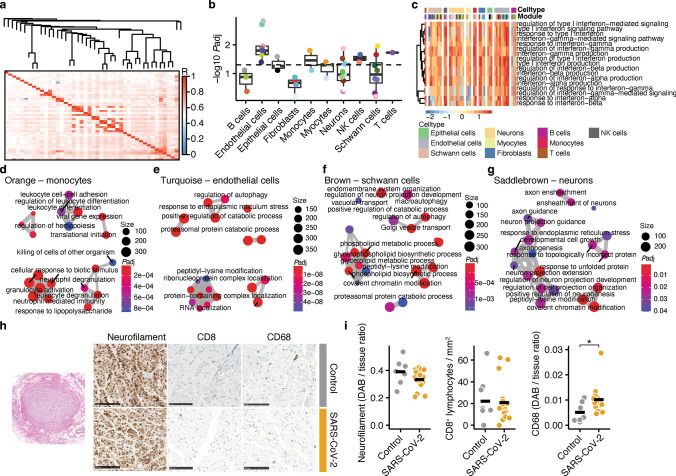
Fig. 2.
Cell-type-dependent inflammatory responses in vagus nerves of COVID-19 patients. a Network heatmap plot of weighted gene-correlated network analysis (WGCNA) for module identification in all samples. b Modules separated by clearly identified cell types through enrichment analysis with PanglaoDB. Modularity between control and COVID-19 samples were compared within each module. P < 0.05 shows significantly stronger enrichment of COVID-19 samples. Dashed line represents P = 0.05. Color represents module. c Heatmap depicting the enrichment of interferon signaling and response GO terms in all identified modules. Cell types and modules are separately labeled as individual colors. Color range shows row z-score. Non-significant enrichment is depicted as gray tile. d–g Emap plots of GO term enrichment analyses in the orange monocyte (d), turquoise endothelial cell (e), brown Schwann cell (f), and saddle-brown neuronal (g) modules. Interferon signaling GO terms were excluded. Color shows FDR-adjusted P value. Size shows number of genes included in the GO term. h Representative images of neurofilament, CD8, and CD68 in vagus nerves of control (top) and COVID-19 (bottom) samples. Scale bar shows 50 µm. i Comparison of neurofilament (DAB/tissue intensity ratio), CD8+ T cells per mm2 and CD68 (DAB/tissue intensity ratio) between control (n = 8, except for CD68 where 1 outlier was removed since it was > 3.5 × z-score of all samples) and COVID-19 samples (n = 16). Student’s t-test was used for statistical comparison. *P < 0.05

