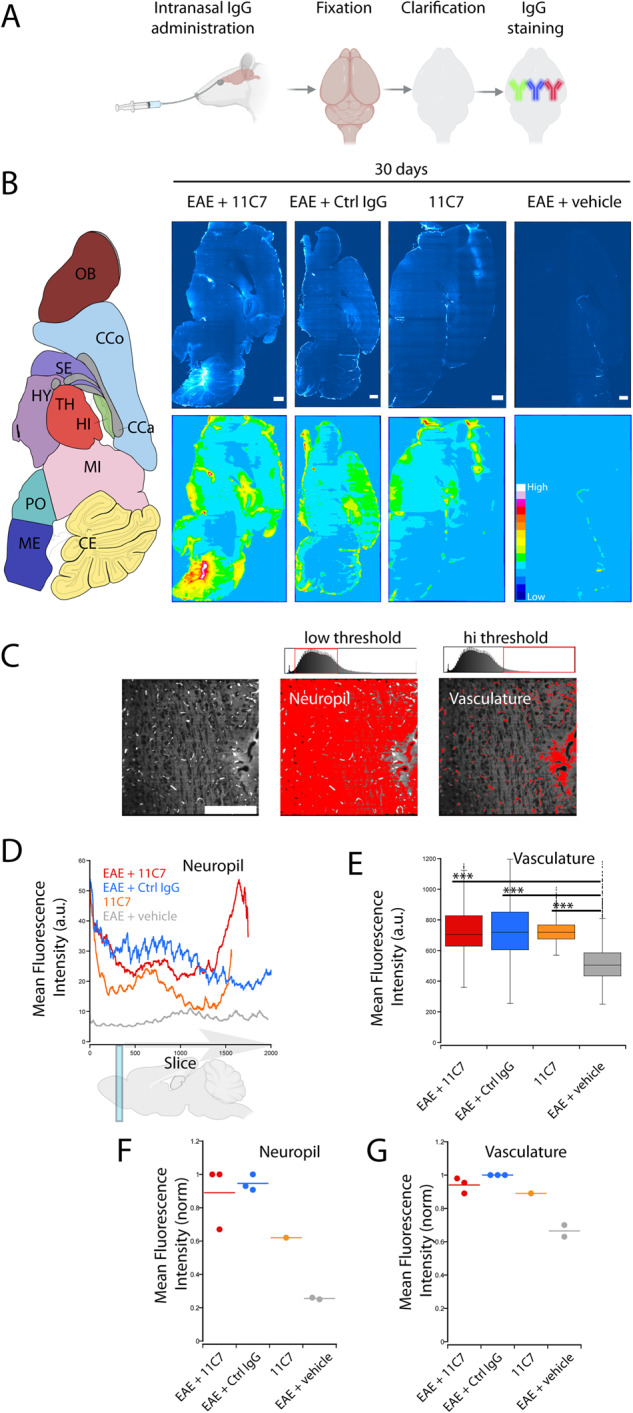
Fig. 3. Brain distribution of IgG after intranasal administration.

A Methodological approach for whole brain processing with CLARITY after the administration of IgG on the olfactory mucosa (cartoon produced with the Biorender software). B Representative images of IgG immunostaining on sagittal optical sections of mouse brains acquired by light-sheet microscopy, after tissue clearing and IgG detection by immunofluorescence. Scale bar = 1 mm. C Two different thresholds were applied to discriminate IgGs accumulated in the neuropil (low fluorescence intensity) and the vasculature (high fluorescence intensity). Scale bar = 500 μm. D Neuropil profiles of IgG fluorescence between the olfactory bulb and the cerebellum (1 brain/condition). E Average IgG fluorescence in blood vessels (1 brain/condition). Student’s t-test, ***P < 0.001. F, G Average fluorescence intensity of the neuropil (F) and vasculature (G) of brains undergoing different treatments. Each dot corresponds to the mean fluorescence intensity of a brain from independent experiments, normalized to the highest mean value for each set of experiments. n = 3 brains for EAE + 11C7, 3 for EAE + Ctrl IgG, 2 for EAE + vehicle, 1 for 11C7.
