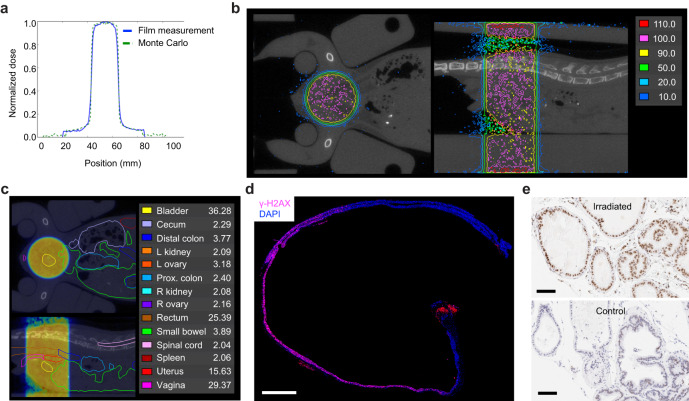
Fig. 2. Modeling and verification of radiation dose distribution in mice.
a Comparison of measured and modeled dose distribution for a 2 cm radiation field. b Representative dose distribution of a 1 cm circular pelvic radiation field mapped onto coronal (top view) and sagittal (side view) CT image of a female mouse. The reference isodose (100%) is shown in pink. Areas enclosed by the red line receive a dose >110% of the reference dose. Areas outside the dark blue line receive a dose <10% of the reference dose. c Coronal and sagittal abdominopelvic CT image of a female mouse with organs outlined as indicated. Mean organ dose in Gy is shown for a prescribed dose of 37.5 Gy. Dose distribution of a 1 cm circular pelvic radiation field is shown as a dose wash to allow visualization of organs. Dose color scheme as in (b). d Evaluation of focal DNA damage in a longitudinal cross-section of colorectum by γ-H2AX staining. This animal was treated with 15 Gy to a 2 cm field centered in the pelvis 30 min prior to tissue collection. Nuclear γ-H2AX foci are seen only in the portion of the colorectum that was within the radiation field. The red signal at the anus is due to autofluorescence. Composite image was generated by stitching 24 individual images taken with a 10X objective. Scale bar = 2 mm. e Evaluation of focal DNA damage by γ-H2AX IHC in prostate glands. The animal was treated with 15 Gy to a 2 cm field centered over the prostate 30 min prior to tissue collection. The lower panel shows prostate tissue from an unirradiated control. Scale bar = 100 µm.

