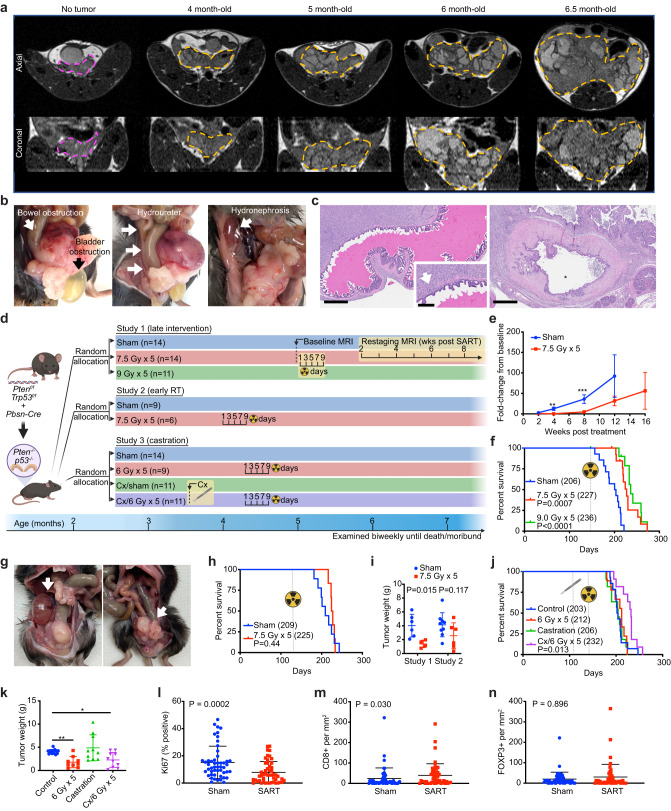
Fig. 6. Stereotactic ablative radiotherapy (SART) modestly improves survival an autochthonous model of locally aggressive prostate cancer.
a Tumor progression in Pten;Trp53pc–/– mice assessed by serial MRI. Representative axial view (upper panels) and coronal view (lower panels) of pelvis with prostate tumor outlined in orange. In all cases the axial and coronal slice with the largest square area of tumor is shown. A 3-month-old mouse without visible prostate tumor outlined in magenta is shown for comparison. b Obstruction of bladder, ureter, and rectum documented at time necropsy in untreated mice. c Histologic sections showing seminal vesicle invasion (arrow) and compressed bladder with small lumen (*) engulfed by tumor. Scale bar = 600 μm (main image) 200 μm (inset). d Graphical representation of prostate cancer GEMM and study design, including timing of interventions. Cx, castration. e Tumor progression assessed by MRI in study 1. n = 7 for sham cohort, n = 14 for SART cohort. Fold-change from baseline is defined as follows: (tumor volume at time of analysis—pretreatment tumor volume) divided by pretreatment tumor volume. Data is shown as mean ±SEM. See Supplementary Fig. 10a for individual tumor data points and raw tumor volume values. **p < 0.01, ***p < 0.001 by unpaired two-tailed t test. f Cancer-specific survival in study 1. Event defined as death or euthanasia due to tumor burden. Animals with cause of death other than tumor burden were censored (2 in each radiation cohort developed severe gastrointestinal toxicity requiring euthanasia). Number in parenthesis = median survival in days. P value estimate by log-rank test. g Hydronephrosis (left arrow) and rectal obstruction (right arrow) documented at time necropsy in mice treated with SART. h Overall survival in study 2. Number in parenthesis = median survival in days. P value estimate by log-rank test. i Tumor weight at time of necropsy in study 1 (SART at 5 months) and study 2 (SART at 4 months). Mean ±SD. P value estimate by unpaired two-tailed t test. j Overall survival in study 3. Number in parenthesis = median survival in days. P value estimate by log-rank test. k Tumor weight at time of necropsy in study 3. Mean ±SD. P value *p < 0.05, **p < 0.01 by unpaired two-tailed t test. l Percent Ki67 positive cells assessed by IHC in SART-treated tumors (9 Gy x 5) and controls from study 1 (n = 5). The time interval between treatment and tumor collection was 51–83 days. For each tumor 10 high power fields (HPF) were analyzed. Mean ± SD. P value estimate by Mann–Whitney test. m CD8+ T cells assessed by IHC in SART-treated tumors and controls as in (l), 10 HPF per tumor. Mean ±SD. P value estimate by Mann–Whitney test. n FOXP3+ T cells assessed by IHC in SART-treated tumors and controls as in (l), 10 HPF per tumor. Mean ±SD. P value estimate by Mann–Whitney test.

