
Fig. 3. Peptide stabilization of HLA-E surface expression.
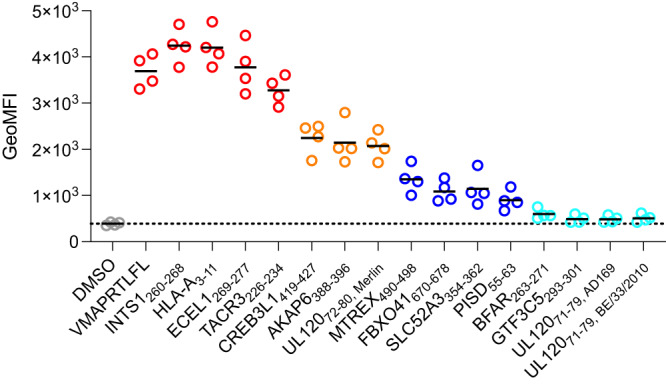
Assessment of peptide-HLA-E binding via HLA-E surface stabilization assay with RMA-S/HLA-E cells incubated with 30 μM peptide. HLA-E expression is detected with an anti-HLA-E antibody. Measurements from n = 4 replicate experiments are shown, with solid black lines indicating mean values. Peptides with similar stabilization effects are plotted in the same color; in order from most to least stabilizing, the colors are: red, orange, blue, and cyan, with DMSO control in gray. Source data are provided as a Source Data file.