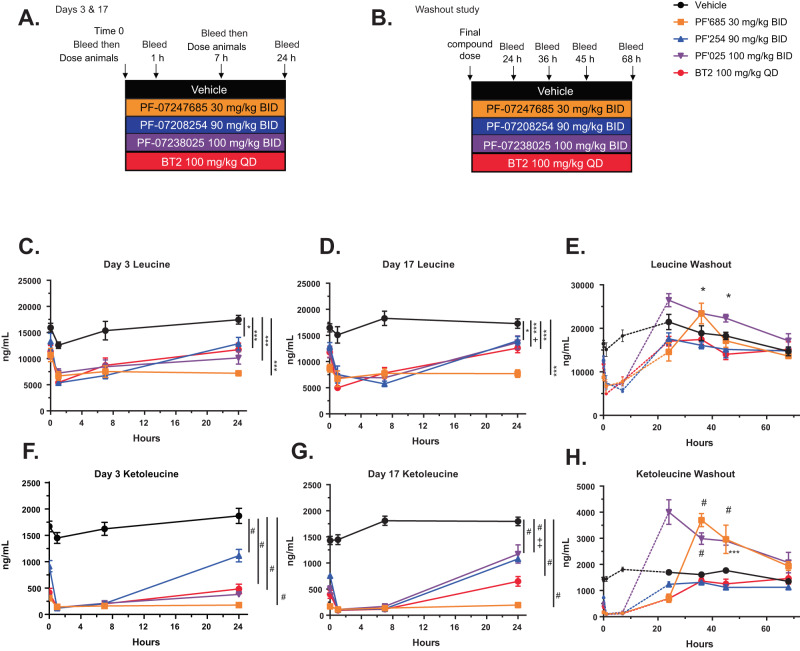
Fig. 5. Washout PK/PD demonstrates different pharmacological profiles of thiazole and thiophene BDK inhibitors.
Mice were fed HFD for 10 weeks, at which time animals were randomized into groups, and treated BID or QD as indicated with vehicle, BT2, PF-07208254, PF-07247685, or PF-07238025 at maximal inhibitory doses. A Study design. Mice were bled immediately prior to dosing compound, 1 h post compound dose, 4 h post compound dose, 7 h post compound dose (immediately prior to 2nd daily compound dose if BID dosed), and 24 h after first compound dose on day 3 and day 17 (N = 8–9 animals/group; a longitudinal mixed effects model with an unstructured covariance was used for statistics for C–D, F–G). B After the final compound dose on day 19, animals were bled at 24 h, 36 h, 45 h, and 68 h on days 20–21 (N = 5 animals/group; a longitudinal mixed effects model with a random intercept for each mouse and an AR(1) covariance structure was fit for statistics for E, H). C Leucine was measured on day 3, (D) day 17 (*p = 0.043, **p = 0.01, ***p = 0.001, #p < 0.0001, +within group, p = 0.049 from day 3), and (E) upon compound washout (*p = 0.047, 0.013). F Ketoleucine was measured on day 3, (G) day 17 (#p < 0.0001, ++ within group, p < 0.001 from day 3), and (H) upon compound washout (#p < 0.0001, ***p = 0.001). Dashed lines in panels E, H represent the 0–7 h time points from D and G for visualization purposes. Data represent the mean ± SEM. Source data are provided as a Source Data file.

