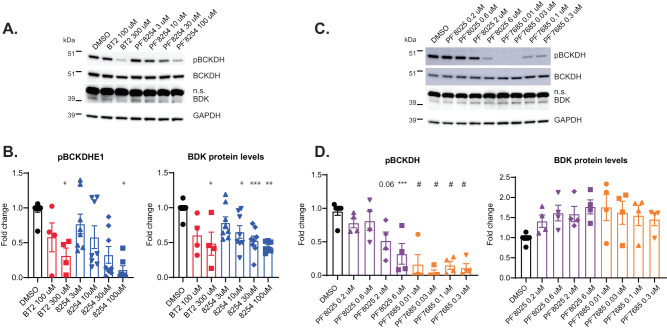
Fig. 7. Differing effects of thiazoles and thiophenes on pBCKDH and BDK protein levels in human cells.
A–D Hek293 cells were treated in culture with compounds for 48 h. A, B Cells were treated with PF-07208254 or BT2 in a dose response. A Representative Western blot images. B Densitometric analyses of pBCKDH/BCKDH (left panel) and BDK/GAPDH (right panel) (pBCKDH *p = 0.036, 0.049, BDK *p = 0.014, 0.033 ***p = 0.004, 0.005). C, D Cells were treated with PF-07238025 or PF-07247685 in a dose response. C Representative Western blot images. D Densitometric analyses of pBCKDH/BCKDH (left panel, ***p = 0.002, #p < 0.0001) and BDK/GAPDH (right panel). n.s. non-specific band. (N = 4–8 independent experiments; one-way ANOVA with Tukey HSD test was performed for statistical analyses). Data represent the mean ± SEM. Source data are provided as a Source Data file.

