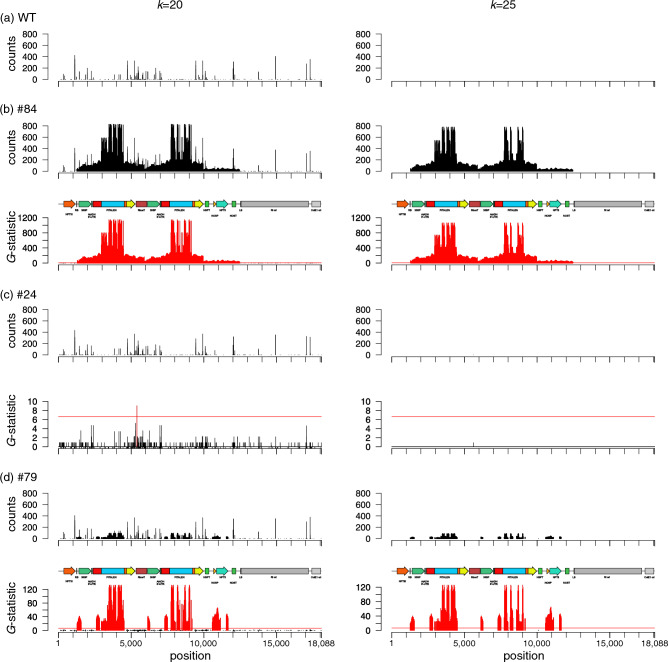
Figure 1.
Detection of identical k-mers between the actual genome-edited potato genome and vector sequences. Data obtained from the wild-type (WT) (a) and selected genome-edited potato lines #84 (b), #24 (c) and #79 (d) are shown for k = 20 (left) and k = 25 (right). Line #84, in which transgenes were detected by PCR in a previous study, was used as a positive control. The results of the counts and G-statistic values (against the WT) at each position in the pYS_026-SSR2_C vector sequence used in genome-editing are shown in the vertical plots. The red horizontal line corresponds to the 1% significance level (G-values > 6.634) and the vertical plots exceeding this line are shown in red. Plasmid maps are also shown above the results. The results for other genome-edited lines are shown in Fig. S1. The k-mer analysis results obtained by repeated NGS experiments are shown in Fig. S2.

