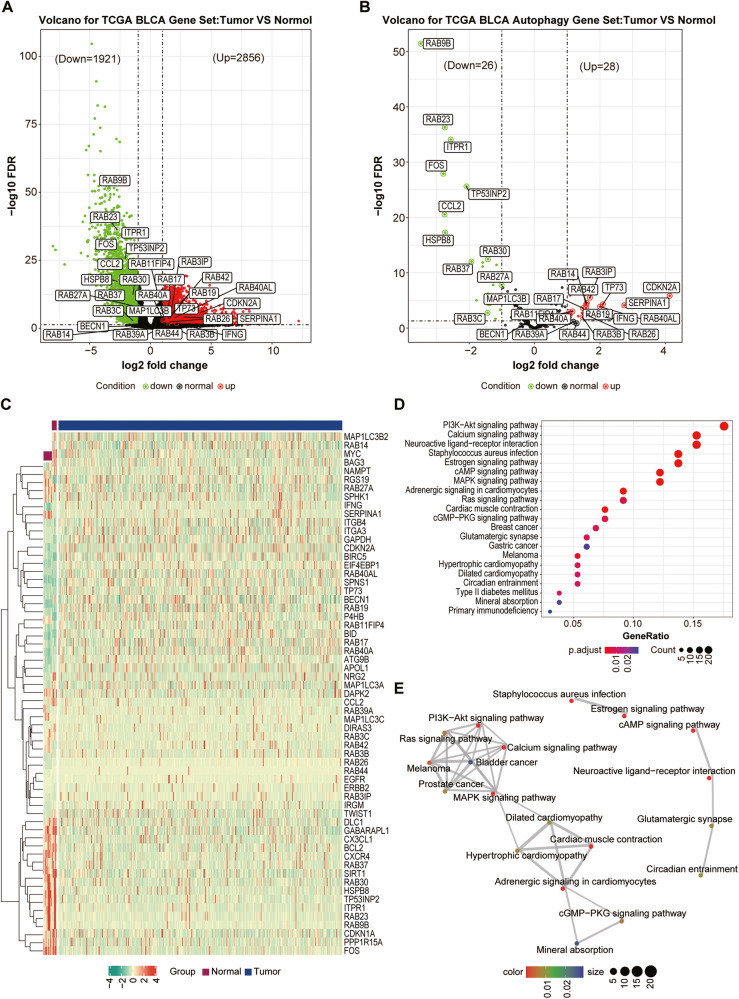
Fig. 1. Identification and screening of Differentially Expressed Genes in BCLA.
A Volcano plot of DEGs between BCLA patients and individuals. The red and green points represent up- and down-regulated genes, respectively. B Volcano plot of autophagy-related DEGs between BCLA patients and individuals. The red and green points represent up- and down-regulated genes, respectively. C Heatmap of 54 autophagy-related DEGs. D KEGG enrichment analysis of 54 autophagy-related DEGs. E The constructed pathway network plots of 54 autophagy-related DEGs.

