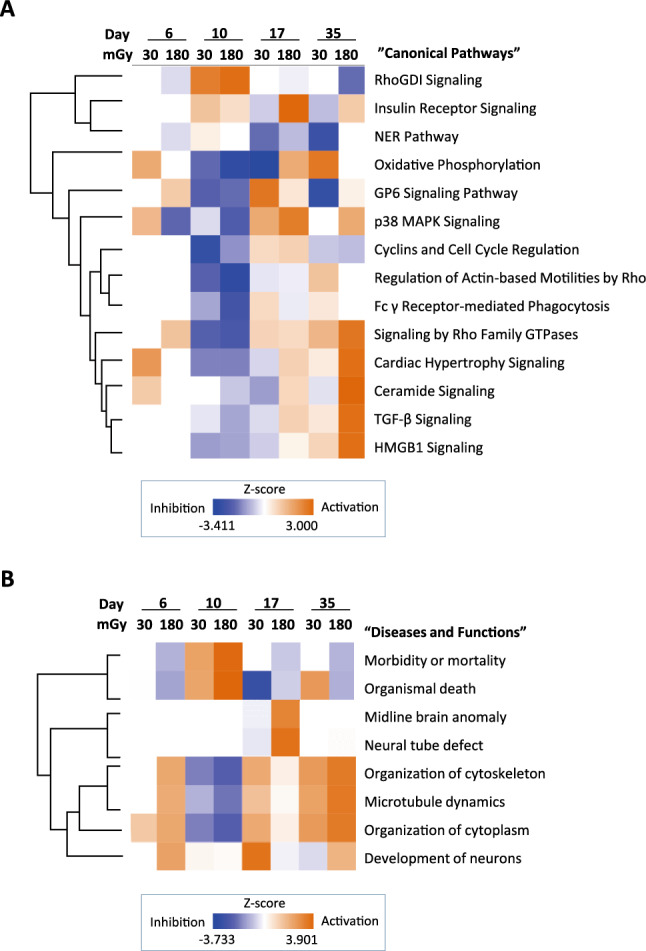
Figure 2.

Pathways altered by low-dose radiation. (A) Clustering heatmap of altered “canonical pathways”. IPA analysis revealed 212 canonical pathways that differed by more than 2–log (p value) in expression in irradiated cells compared to nonirradiated cells according to the RNA-seq data. Among them, 13 with high Z scores (cut-off, 2.5) were clustered. (B) Clustering heatmap of altered “Diseases and functions.” Comparison between the effects of radiation doses (0, 30, or 180 mGy) on days 6, 10, 17, and 35. The IPA-calculated p value and Z score for each “functions and diseases” pathway differed by > 2 of –log (p value) in RNA-seq. Clustering of the eight pathways that had high Z scores (cut-off, 3.0) is shown.
