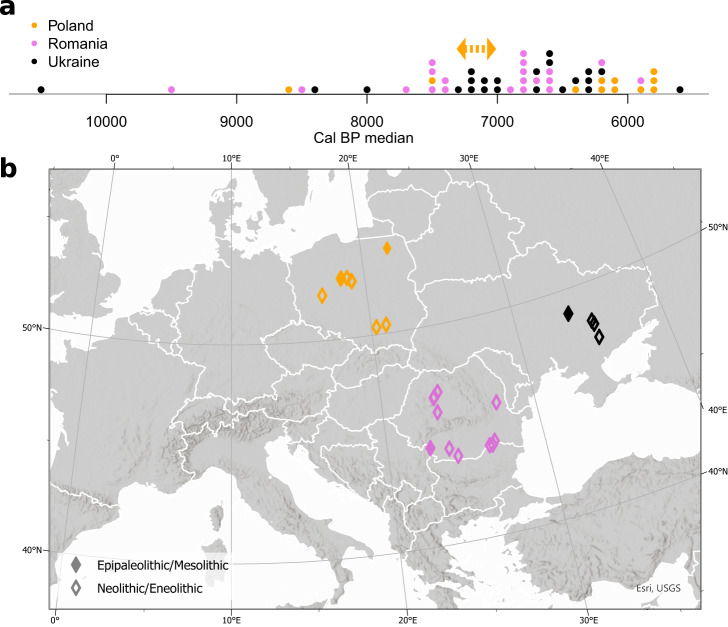
Fig. 1. Summary of the individuals sequenced in this study.
a The distribution of cal BP median of 53 dated individuals. The orange arrow shows the context-based approximate age of three LBK samples (lbk101, lbk102, and lbk104). b Geographic location of the newly sequenced individuals. The map graphic was produced using ArcGIS® pro software by Esri. ArcGIS® pro and ArcMap™ are licensed through Esri. Copyright © Esri. All rights reserved. See www.esri.com for more information about the Esri® software. The basemap was obtained from World Bank Official Boundaries collection99.

