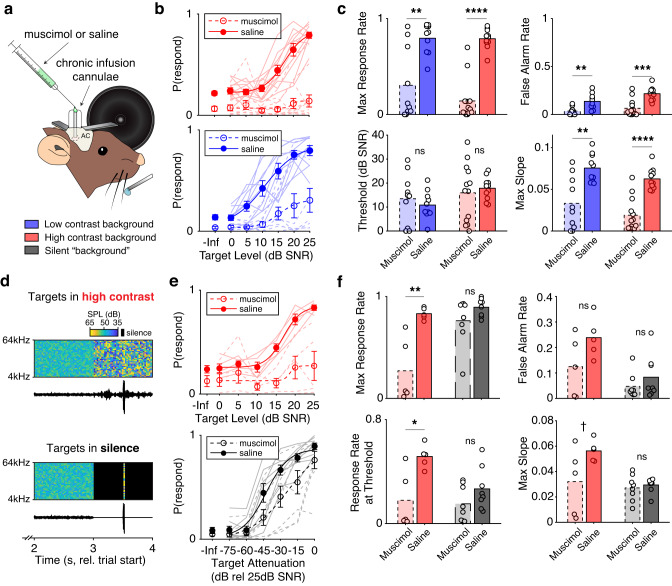
Fig. 4. Inactivation of auditory cortex selectively disrupts detection of targets in background sounds.
a Schematic of chronic muscimol and saline application in behaving mice. Legend indicates the three potential background conditions in the task. b Behavioral performance on individual sessions (light traces) as a function of contrast (red, blue) and muscimol or saline application (dashed and solid lines, respectively) for n = 44 sessions. -Inf indicates performance on background-only trials. Dots indicate the average performance across sessions ±SEM, overlaid with logistic fits to the data. c Effects of muscimol and contrast on multiple behavioral measures. Bars indicate the mean performance across sessions ±SEM, while dots indicate performance on individual sessions (n = 23 muscimol sessions and 21 saline sessions). Asterisks indicate the significance of two-way rank-sum tests (Supplementary Table 1). d Example spectrograms and waveforms with a target presented in high contrast (top) and the same stimulus when the target was presented in silence (bottom). Color bar indicates the sound level, with black indicating silence. e Behavioral performance in high contrast (top) and in silence (bottom) for n = 26 sessions. Error bars are ±SEM across sessions. Formatting as in b. f The effect of muscimol on multiple behavioral measures when targets were presented in high contrast (red bars; n = 10 sessions) or in silence (black bars; n = 16 sessions). Error bars are ±SEM across sessions. Asterisks indicate the significance of two-way rank-sum tests. Formatting as in c. In all plots: ns not significant; †p < 0.1; *p < 0.05; **p < 0.01; ***p < 0.001; ****p < 0.0001. Detailed statistical results for c and f are in Supplementary Table 1. Source data are provided as a Source Data file.

