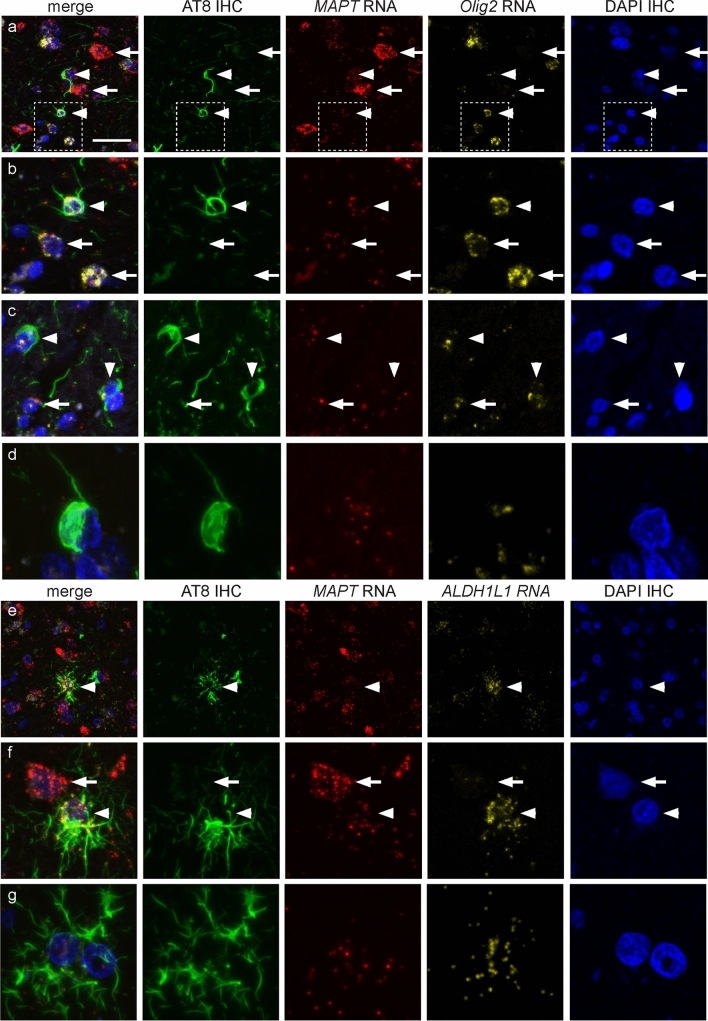
Fig. 6.
Fluorescent RNAscope combined with phosphorylated tau (AT8) immunohistochemistry in oligodendrocytic and astrocytic inclusions in progressive supranuclear palsy (PSP). Each horizontal set represents confocal images taken from the same field of view showing AT8-immunostaining (green), MAPT transcripts (red) and the oligodendrocyte-specific Olig2 or astrocyte-specific ALDH1L1 (yellow) transcripts, DAPI (blue), and the merge image. a Coiled bodies (arrowheads) and neurons (arrow) without neurofibrillary tangles in the frontal cortex. Note the higher density of MAPT transcripts in neurons compared with oligodendrocytes. White box in panel (a) is enlarged in panel (b). b, c Oligodendrocytes with (arrowheads) and without (arrows) tau-immunopositive inclusions show variation in MAPT transcript density, and an enlarged image of an oligodendrocytic coiled body in panel (d). e Tufted astrocyte (arrowhead) in the frontal cortex. f, g Enlarged view of tufted astrocytes, which show variation in the density of MAPT transcripts. Note the higher density of MAPT transcripts in neurons (arrow) compared with the tufted astrocyte (arrowhead) in panel (f). Scale bar in (a) represents 20 μm for (a), 10 μm for (c, d), 5 μm for (d), 30 μm for (e), 12 μm for (f), and 6 μm for (g)

