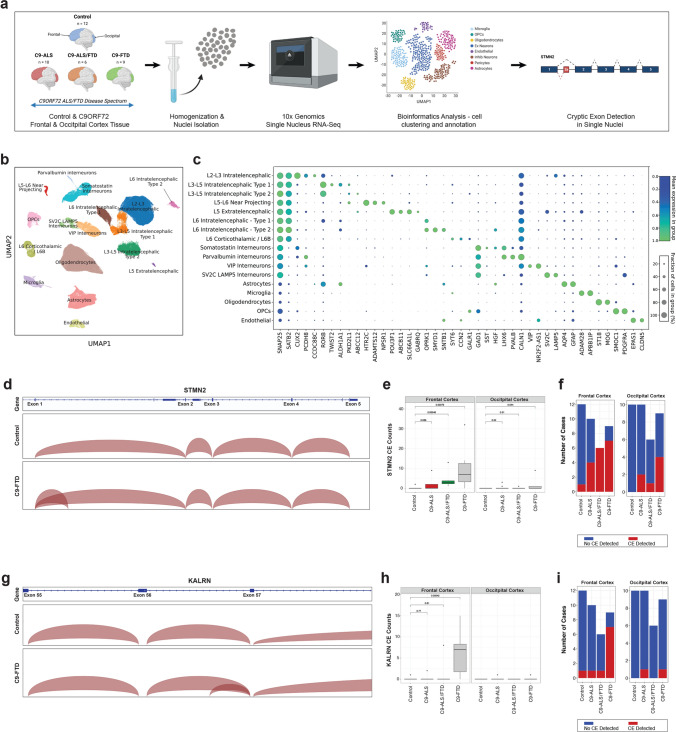
Fig. 1.
Detection of STMN2 and KALRN cryptic exons in single-nuclei sequencing data from subjects with C9-ALS, C9-ALS-FTD, and C9-FTD. a Schematic diagram illustrating the workflow of nuclei isolation, single nuclei sequencing and analysis from the frontal and occipital cortices of subjects with C9-ALS (n = 10), C9-ALS-FTD (n = 6), and C9-FTD (n = 9), and aged-matched controls (n = 12). b UMAP depicting the 270,731 single nuclei sequenced from frontal cortex tissue separating into 17 distinct clusters. c Cell-type annotation performed based on the expression of previously described marker genes for each cell type in the frontal cortex. The size of the dot represents fraction of cells in which the marker gene was detected, and the color represents the average expression level in the cluster. d An IGV plot of the full-length STMN2 gene. The top track shows data from the combined excitatory neuron clusters from control subjects (n = 12). The bottom track shows data from the combined excitatory neuron clusters from subjects with C9-FTD (n = 9). e Box plot of the average STMN2 CE junctions detected per subject in each group. There is a significant increase in the detection of the STMN2 CE between control subjects and C9-ALS/FTD (p = 0.00048; Wilcoxon test) and C9-FTD (p = 0.00079; Wilcoxon test) in the frontal cortex. There was also a significant increase in STMN2 CE detection in the occipital cortex between control and C9-FTD subjects (p = 0.044, Wilcoxon test). f, Stacked bar plot displaying the number of subjects in which an STMN2 CE was detected in the frontal cortex (left) and occipital cortex (right). g An IGV plot of the region of the KALRN gene containing the CE. The top track shows data from the combined excitatory neuron clusters from control subjects (n = 12). The bottom track shows data from the combined excitatory neuron clusters from patients with C9-FTD (n = 9). h Box plot of the average KARLN CE junctions detected per subject in each group. There is a significant increase in the detection of the KALRN CE in C9-FTD (p = 0.00042; Wilcoxon test) in the frontal cortex. i, Stacked bar plot displaying the number of individuals in which a KALRN CE was detected in the frontal cortex (left) and occipital cortex (right)

