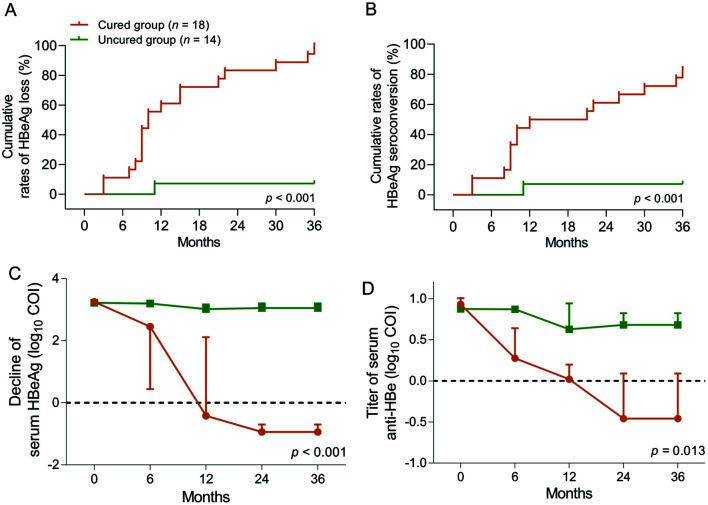
Fig. 3. Cumulative rate of HBeAg loss/seroconversion and other dynamic changes in the blood serology of the cured and uncured children receiving antiviral therapy.
Comparison of dynamic changes in (A) cumulative rates of serum HBeAg loss (log rank test, p<0.001) and (B) seroconversion (log rank test, p<0.001), (C) serum HBeAg, and (D) anti-HBe (generalized estimating equation, p<0.001, p=0.013) in cured (n=18, orange line) vs. uncured (n=14, green line) children on antiviral therapy. Dotted lines in graphs C and D indicate the threshold cutoff values for HBeAg loss (<1 cutoff index (COI) or 0 log10 COI and anti-HBe positivity (<1 or 0 log10 COI). HBeAg, hepatitis B e antigen.

