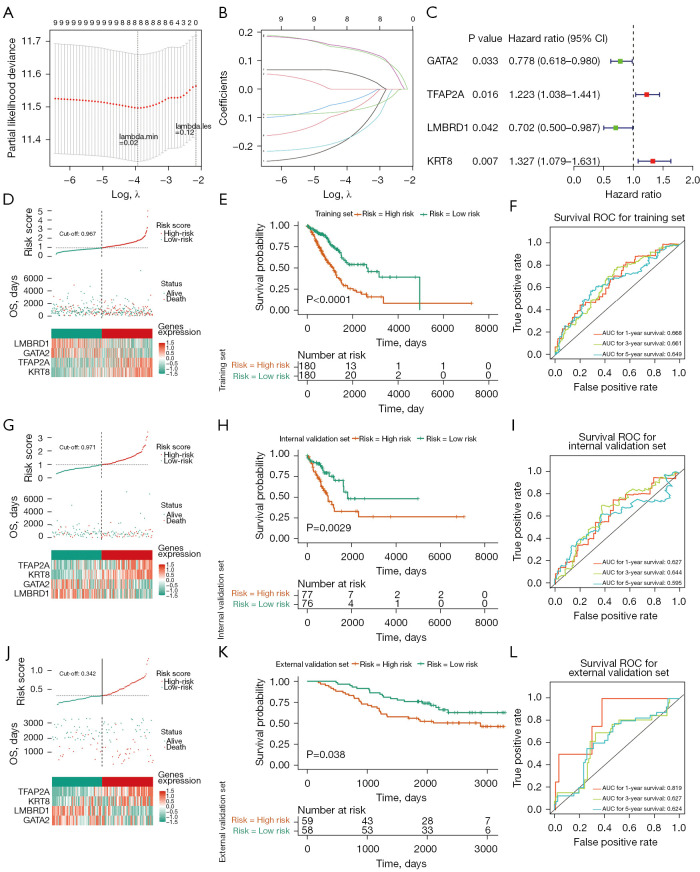
Figure 3.
Construction of the risk model. (A,B) LASSO coefficient profile plots of the nine differential prognostic LRGs. (C) Multivariate Cox analysis of eight feature genes. (D) The risk curve, scatter plot, and model gene expression heatmap of the high-risk group in the training set. (E) Survival analysis of the training set. (F) ROC curve of the training set. (G) The risk curve, scatter plot, and model gene expression heatmap of the high- and low-risk groups in the internal validation set. (H) Survival analysis of the internal validation set. (I) ROC curve of the internal validation set. (J) The risk curve, scatter plot, and model gene expression heatmap of the high- and low-risk groups in the external validation set. (K) Survival analysis of the external validation set. (L) ROC curve of the external validation set. CI, confidence interval; OS, overall survival; ROC, receiver operating characteristic; AUC, area under the curve; LASSO, least absolute shrinkage and selection operator; LRGs, lysosome-related genes.

