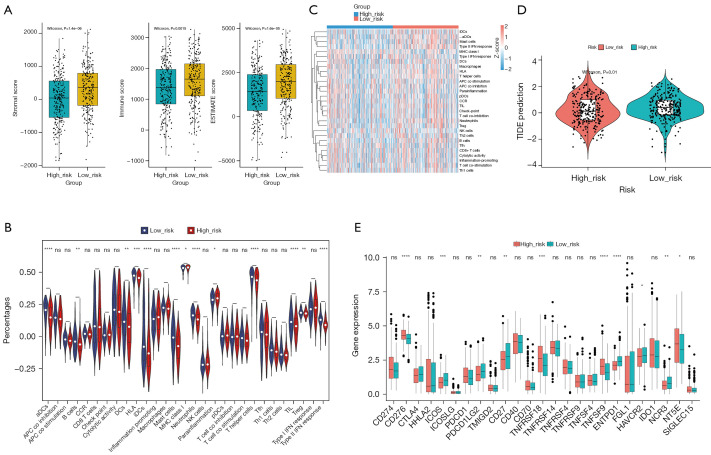
Figure 7.
Analysis of immune cells in the high- and low-risk groups. (A) ESTIMATE score of the high- and low-risk groups. (B) Immune score violin chart of immune cells in the high- and low-risk groups. (C) Immune score heatmap of immune cells in the high- and low-risk groups. (D) Analysis of TIDE score differences between the high- and low-risk groups. (E) Analysis of immunoassay site differences in the high- and low-risk groups. *, P<0.05; **, P<0.01; ***, P<0.001; ****, P<0.0001; ns, no significance. iDCs, immature dendritic cells; aDCs, activated dendritic cells; IFN, interferon; MHC, major histocompatibility complex; DCs, dendritic cells; HLA, human leukocyte antigen; APC, antigen-presenting cell; pDCs, plasmacytoid dendritic cells; CCR, C-C motif chemokine receptor; TIL, tumor-infiltrating lymphocytes; Treg, T cell regulatory; NK, natural killer; Th, T helper; Tfh, T follicular helper; TIDE, Tumor Immune Dysfunction and Exclusion; ESTIMATE, Estimation of Stromal and Immune cells in Malignant Tumor tissues using Expression data.

