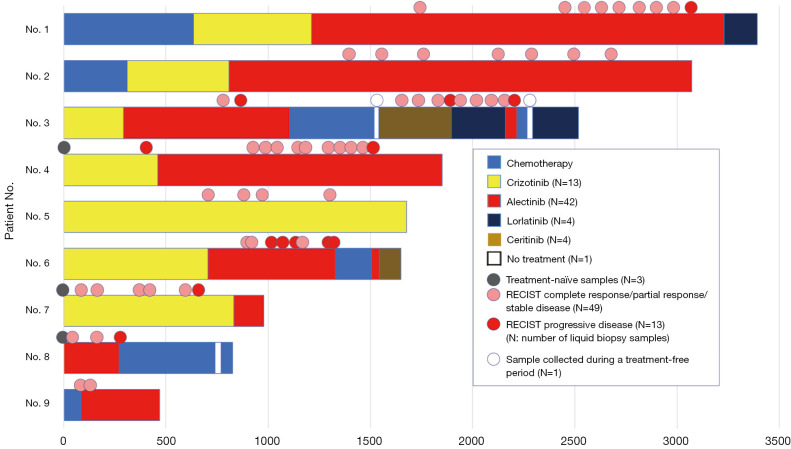
Figure 1.
Temporal relationship between plasma collection and treatment administration. The circles above the box indicate the timing of plasma collection and the bars represent the treatment status of the patient. The colors of the circles indicate treatment response, except that black circles indicate treatment-naïve samples and the white circle indicates a sample that was collected during a treatment-free period. Pink circles indicate clinical response (includes complete response, partial response, and stable disease). Red circles indicate disease progression. The x-axis represents the duration of treatment in days. RECIST, response evaluation criteria in solid tumors.

