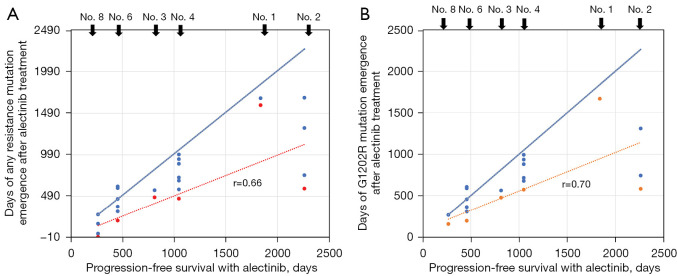
Figure 3.
Correlation between PFS and time from alectinib treatment initiation (or treatment modification) to detection of resistance mutations in six patients. (A) Correlation between PFS and detection of the 10 genetic mutations examined in this study with alectinib treatment. The correlation coefficient between the period when the resistance mutation was detected for the first time and PFS was 0.66. (B) Correlation between PFS and detection of the G1202R mutation with alectinib treatment. The correlation coefficient between the period when the resistance mutation was detected for the first time and PFS was 0.70. In five of six cases, the G1202R mutation was detected repeatedly until disease progression. The blue dots indicate the days when any of the resistance mutation was detected after treatment with alectinib, and the red dots indicate the days when they were first detected. The correlation analyses were performed using Spearman’s rank correlation coefficients. The red dotted lines represent the ‘lines of best fit’ for the red dots. The solid blue lines represent slopes with a correlation of +1 and are provided to indicate where the ‘line of best fit’ would be positioned if the clinical PFS correlated perfectly with the time period in which the resistant mutation appeared; thus, the figure indicates that the resistant mutation was detected earlier than what would be expected if clinical PFS was perfectly correlated with the appearance of the resistant mutation. PFS, progression-free survival.

