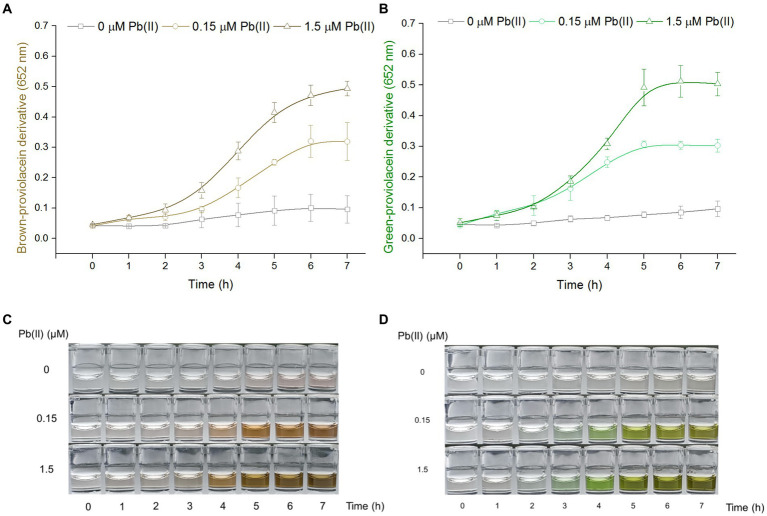
Figure 2.
The time-dose–response relationship of PV-based biosensors exposed to Pb(II). Cultures of TOP10/pPb-vioABDE were induced with three concentrations of Pb(II) at 37°C and sampled at 1-h intervals. The n-butanol extracts were separated and transferred into a 96-well plate. The time-dose–response curves using A652 of 100 μL n-butanol phase after non-oxidation (A) and oxidation (B) treatment were made. The result was the mean ± standard deviation of three independent determinations. Representative photos of two colored n-butanol phases from non-oxidation treatment (C) and oxidation treatment (D) groups are shown.

