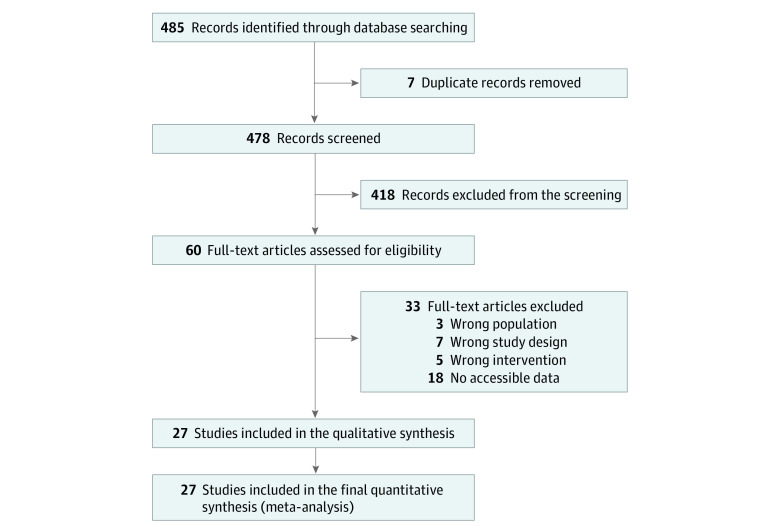
Figure 1. Preferred Reporting Items for Systematic Reviews and Meta-Analyses Flow Diagram Illustrating the Study Selection Process.
The flow diagram shows the number of studies identified through the initial literature search, the number of studies screened for eligibility based on predetermined criteria, the number of studies included in the qualitative synthesis, and the number of studies included in the quantitative analysis. The diagram helps to track the selection process and provides transparency in the study selection procedure.

