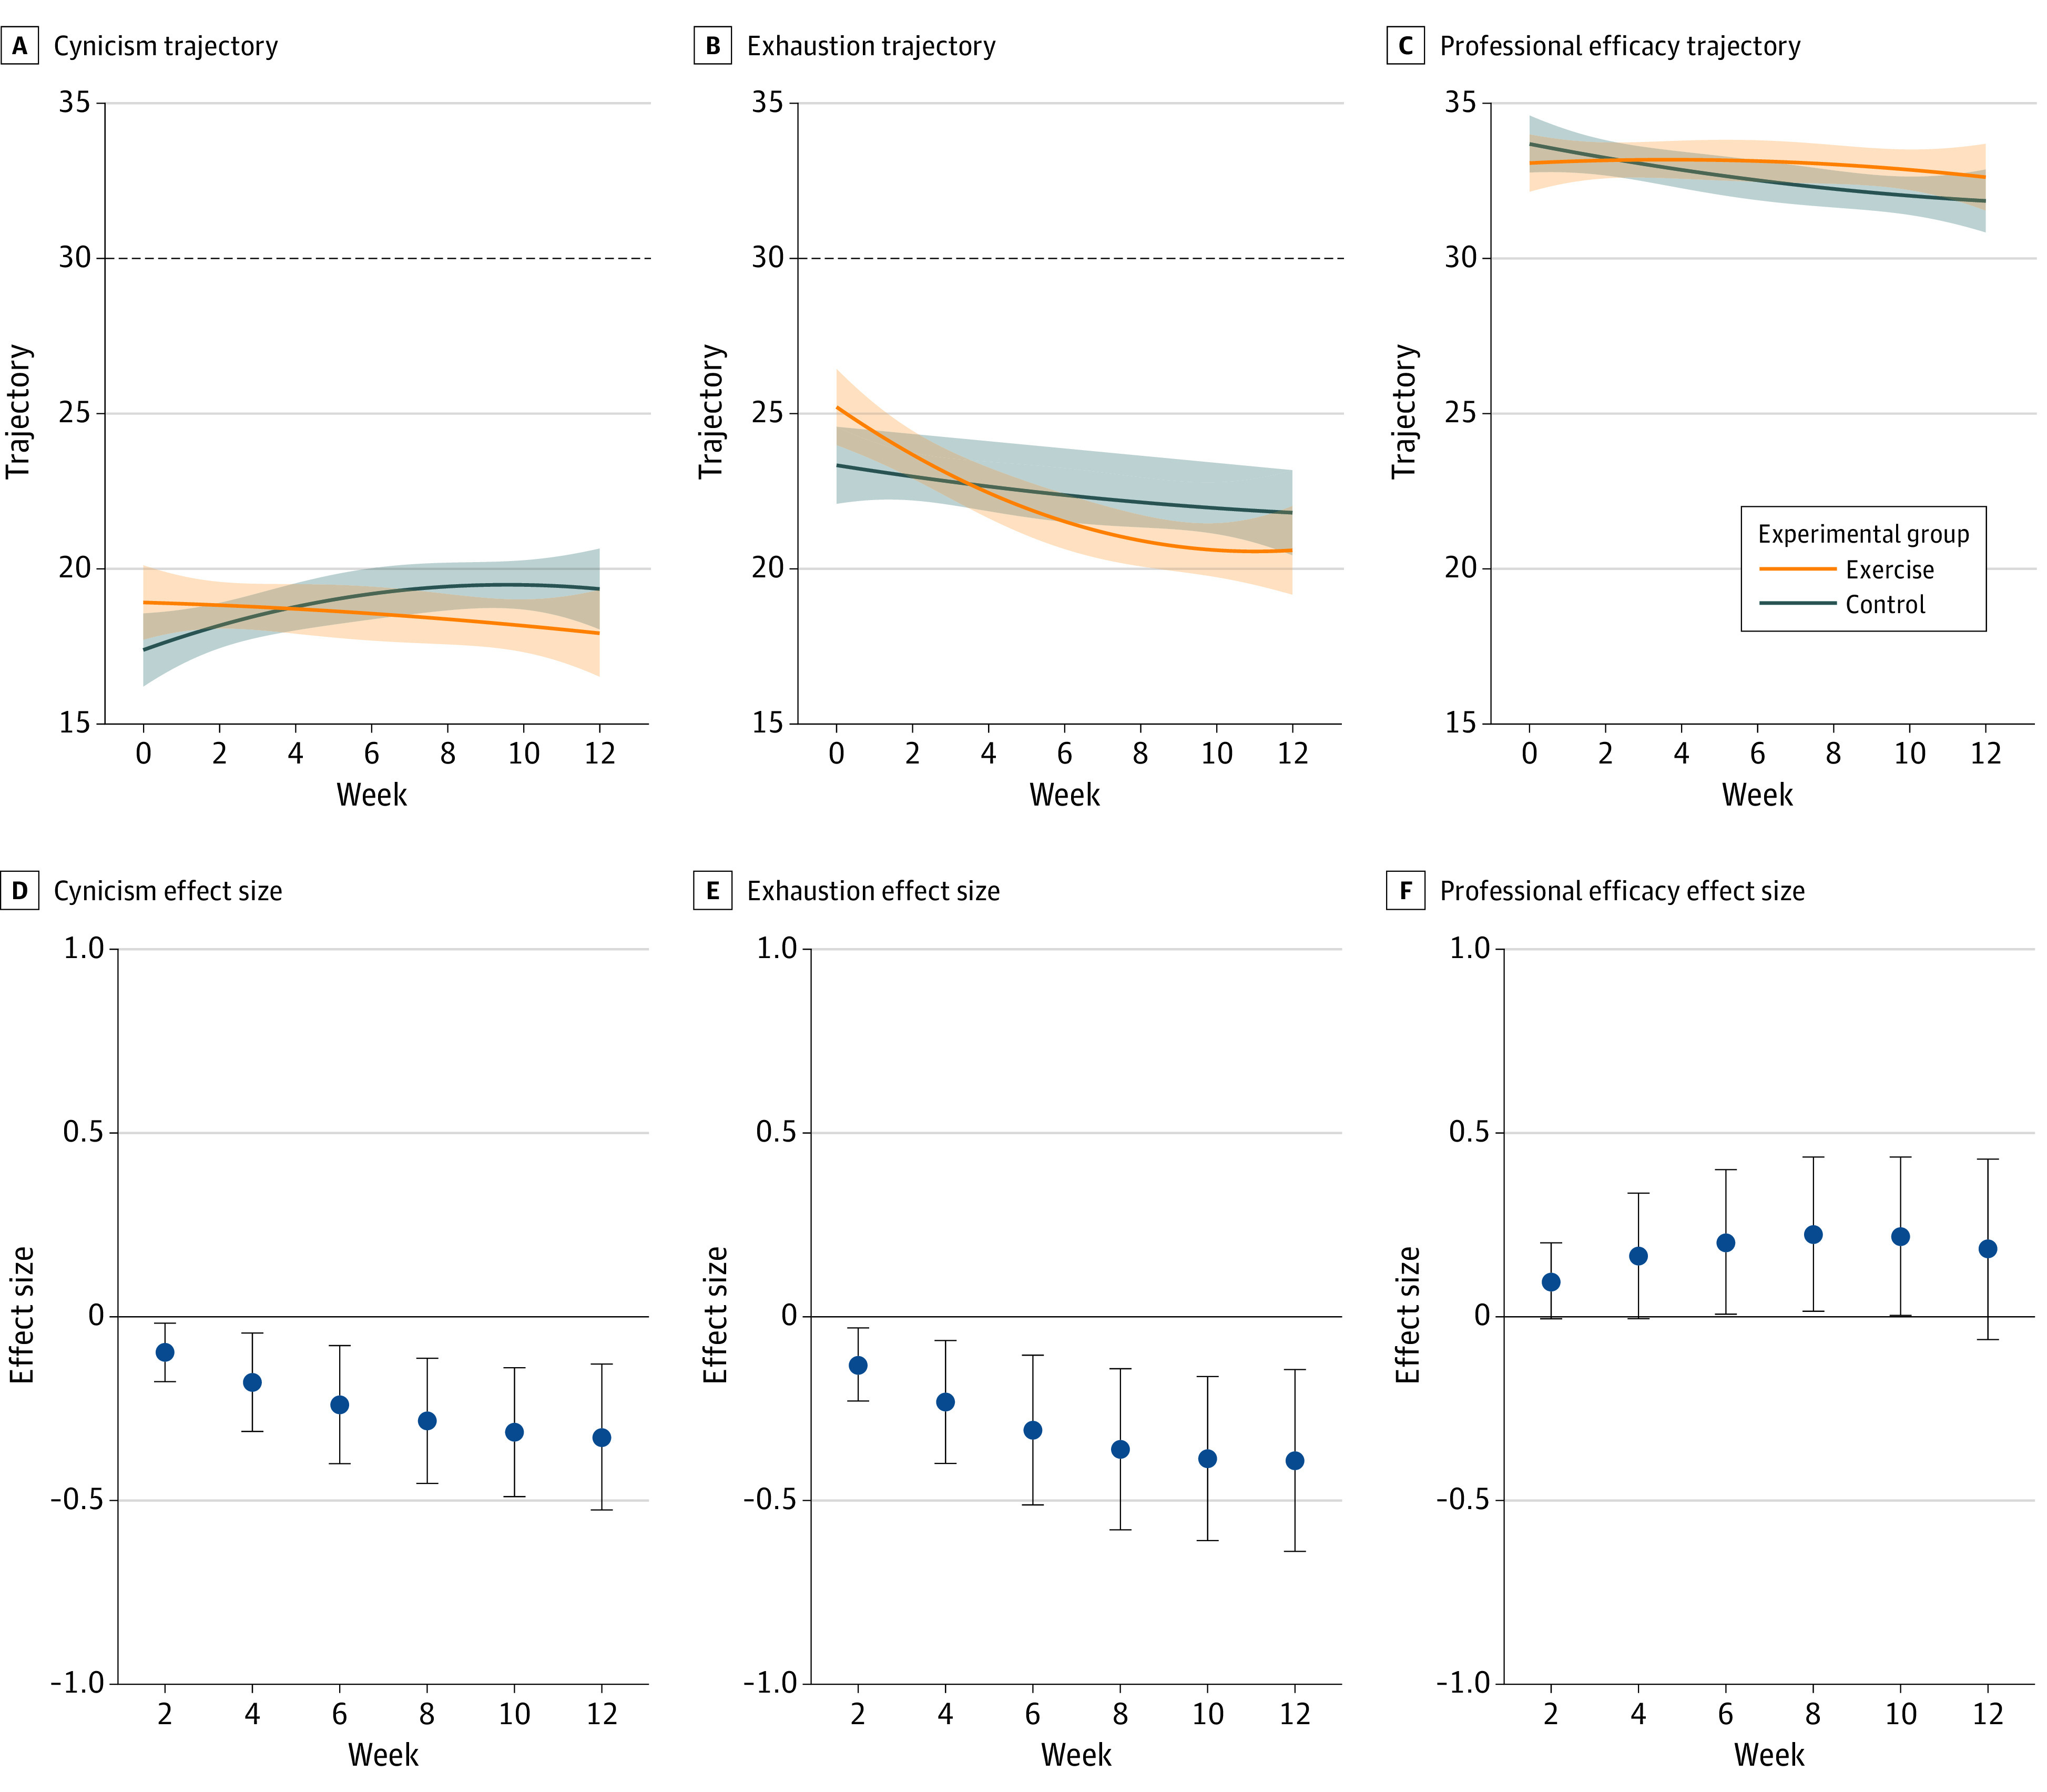
Figure 3. Burnout Subfacet Trajectories and Biweekly Effect Sizes Across Time.

Trajectories across time and biweekly effect sizes for burnout subfacets are shown for the exercise and wait list control conditions. Horizontal dashed lines indicate scale maximums; shaded areas and error bars indicate 95% CIs.
