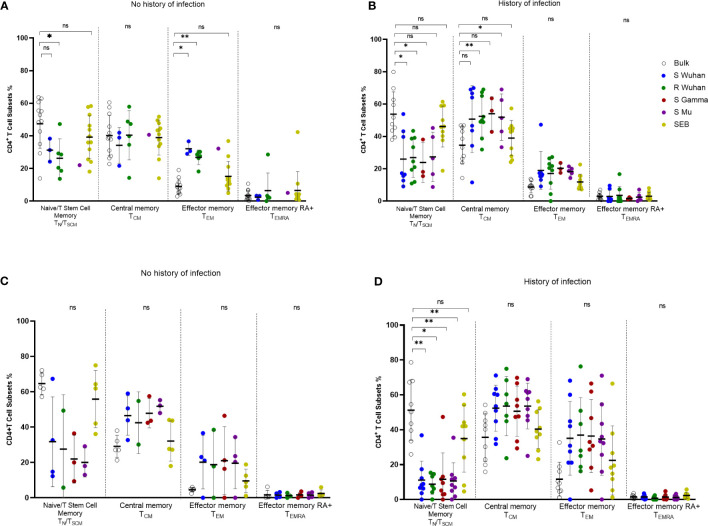
Figure 6.
Changes in the phenotype of SARS-CoV-2 specific CD4+ T cells according to the history of antigen exposure. Phenotype of SARS-CoV-2-specific CD4+ T cells evaluated by the AIM assay (OX40+CD137+ CD4+ T cells) in pre-vaccination (A, B) or post-vaccination (C, D) samples from individuals without (A, C) or with history of SARS-CoV-2 natural infection (B, D). Each symbol represents an individual sample. The geometric mean and 95% CI are shown. The Kruskal-Wallis and Dunn post-hoc tests were performed. ns, Not statistically significant. *p-value <0.05; **p-value <0.01.

