. 2023 Jul 28;5(4):e220126. doi: 10.1148/rycan.220126

Figure 3:

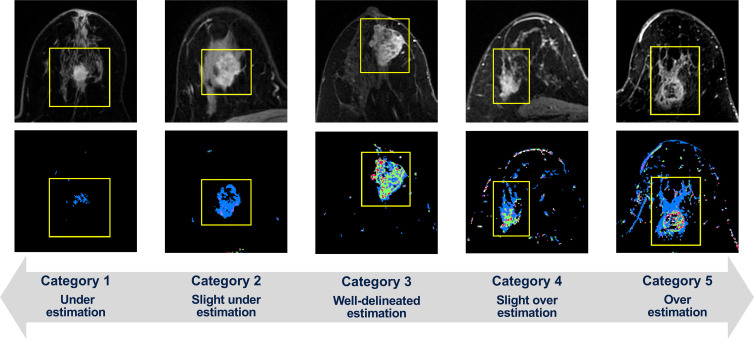
Within bounding boxes (yellow line), tumors on early postcontrast-phase axial MR images (top) and corresponding functional tumor volume (FTV) estimation on signal enhancement ratio (SER) maps (bottom) show the variation in FTV estimation as visually assessed using five categories, with representative cases of each category shown. The SER maps are colored as follows: red, SER >1.1 (washout); green, 0.9 ≤ SER ≤ 1.1 (plateau); blue, SER <0.9 (persistent).

Within bounding boxes (yellow line), tumors on early postcontrast-phase axial MR images (top) and corresponding functional tumor volume (FTV) estimation on signal enhancement ratio (SER) maps (bottom) show the variation in FTV estimation as visually assessed using five categories, with representative cases of each category shown. The SER maps are colored as follows: red, SER >1.1 (washout); green, 0.9 ≤ SER ≤ 1.1 (plateau); blue, SER <0.9 (persistent).