. 2023 Jul 28;5(4):e220126. doi: 10.1148/rycan.220126

Figure 4:

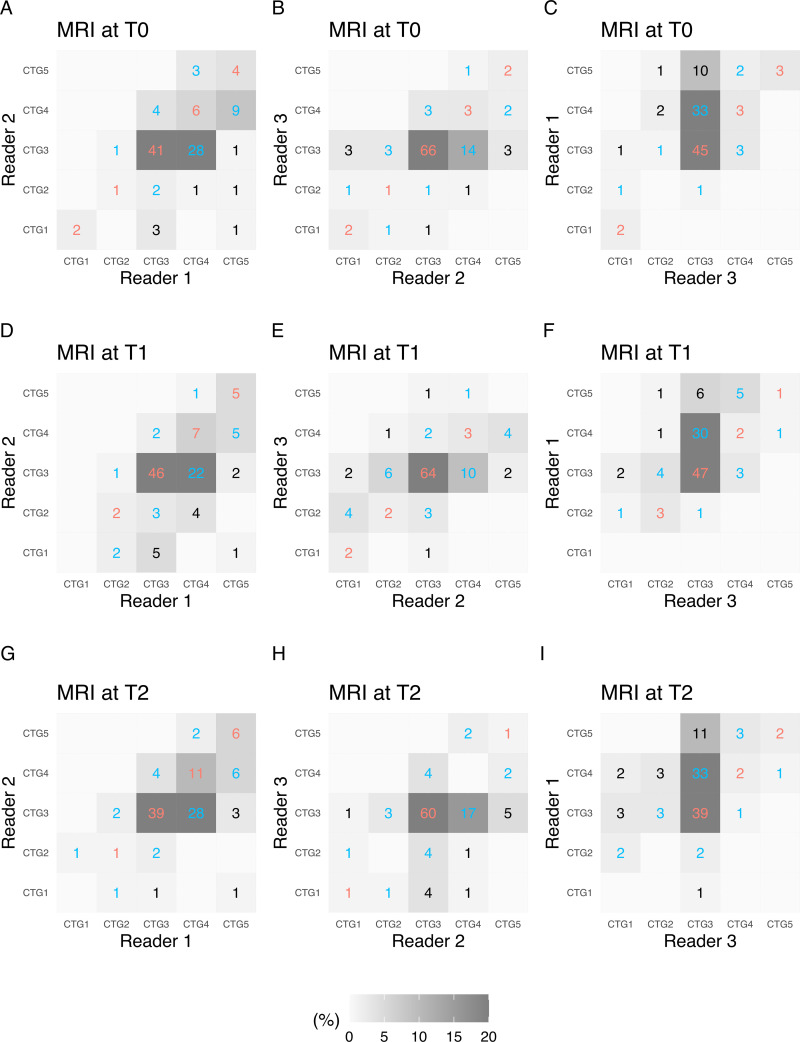
Pairwise interreader agreement matrices for functional tumor volume (FTV) show estimation categorization at three MRI time points as follows: (A–C) pretreatment (T0), (D–F) early treatment (T1), and (G–I) inter-regimen (T2). Data within the matrices are numbers of participants, and the gray scale represents the proportion of participants. Agreements are indicated in red text and disagreements are indicated in blue text, per category (CTG).

Pairwise interreader agreement matrices for functional tumor volume (FTV) show estimation categorization at three MRI time points as follows: (A–C) pretreatment (T0), (D–F) early treatment (T1), and (G–I) inter-regimen (T2). Data within the matrices are numbers of participants, and the gray scale represents the proportion of participants. Agreements are indicated in red text and disagreements are indicated in blue text, per category (CTG).