

Abstract
Temozolomide (TMZ) is considered a first line chemotherapy drug for glioblastoma (GBM). Unfortunately, the GBM without methylation of O6-methylguanine-DNA methyltransferase (MGMT), accounting for about 70% of all GBM, shows an inherent resistance to TMZ treatment. Aberrant accumulation of neutral lipids, primarily triglycerides (TGs) and cholesteryl esters (CEs), in lipid droplets (LDs) has been recognized as metabolic vulnerability for GBM therapy. However, it is not known whether MGMT methylation affects lipid accumulation in GBM. Herein, we employed label-free Raman spectromicroscopy, which integrated stimulated Raman scattering (SRS) microscopy and confocal Raman spectroscopy, to quantitatively analyze both the amount and composition of intracellular LDs in intact GBM tissues obtained from patients who had undergone resection surgery. Our results showed significant reductions in both the LD amount and the CE percentage in MGMT unmethylated GBMs (MGMT methylation < 15%) compared to MGMT methylated ones (MGMT methylation ≥ 15%). Due to a big variation of lipid accumulation in the MGMT methylated GBMs, these patients were further divided into hypermethylated group (MGMT methylation ≥ 50%) and intermediate-methylated group (MGMT methylation 15∼50%), according to the significantly different median survival rates of these two groups. Remarkable differences in LD amount, CE percentage, and also lipid saturation degree were found between the hypermethylated group and the other two groups, but not between the unmethylated and intermediate-methylated groups. To elucidate the possible underlying mechanism, we analyzed the differential expression of lipid metabolism-related genes in GBM with different levels of MGMT methylation using The Cancer Genome Atlas Program (TCGA) dataset. It was shown that the genes related to lipid oxidation and lipid efflux were upregulated, and the genes related to lipid synthesis were downregulated in unmethylated group. These findings unravel the relationship between MGMT methylation and lipid accumulation in GBM, which may offer new opportunities for the diagnosis and treatment of TMZ-resistant GBM.
Introduction
Glioblastoma (GBM) is the most common and malignant primary brain tumor with poor survival and high heterogeneity.1 The current standard treatment for newly diagnosed GBM is surgical resection with concurrent radiation and alkylating chemotherapy, followed by adjuvant alkylating chemotherapy.2,3 Temozolomide (TMZ) treatment has been shown to increase the overall survival (OS) of GBM patients.4,5 The therapeutic benefits of TMZ depend on its ability to methylate DNA at the N7 and O6 positions of guanine and the N3 position of adenine.6 It has been found that GBM with methylation of the DNA repair enzyme O6-methylguanine-DNA methyltransferase (MGMT) is sensitive to TMZ, whereas GBM without MGMT methylation is resistant to TMZ.7 Currently, there is still no effective treatment available for MGMT unmethylated GBM, accounting for about 70% of all GBM.8
As a hallmark of human cancers, dysregulated lipid metabolism has been shown to induce intracellular accumulation of neutral lipids, primarily triglycerides (TGs) and cholesteryl esters (CEs), in lipid droplets (LDs).9−11 Aberrant neutral lipid accumulation has been recognized to be a vulnerable metabolic target for GBM treatment.12−14 Thus, it is intriguing to explore whether such lipid accumulation is universal for all GBM or related to MGMT methylation.
Due to limited spatial resolution or analytical capability, regular methods cannot provide information regarding LD distribution and composition at the same time as intact tissue, which hinders the study of LD biology in cancer. Owing to high chemical selectivity, submicron spatial resolution, and high imaging speed, stimulated Raman scattering (SRS) microscopy has shed new light on LD biology.15−17 Label-free Raman spectromicroscopy, which combines the fast chemical imaging capability of SRS microscopy and the full spectral analysis capability of spontaneous Raman spectroscopy on the same platform, permits quantitative analysis of not only the amount but also the composition of LDs in single cells.18 SRS spectral imaging has been applied to the study of lipid metabolism in various types of cancer, including prostate cancer,19 pancreatic cancer,20 ovarian cancer,21 liver cancer,22 and melanoma.23,24 Particularly, SRS imaging revealed cisplatin-resistant cancer cell exhibited increased fatty acids (FA) uptake and oxidation.25 Taken together, label-free Raman spectromicroscopy could provide new insights into the relationship between intracellular lipid accumulation and MGMT methylation in GBM.
Here, enabled by label-free Raman spectromicroscopy, we quantitatively analyzed lipid accumulation, including both the amount and composition of intracellular LDs in GBM tissues obtained from patients undergone resection surgery. Our results revealed significant reductions in both LD amount and CE percentage in MGMT unmethylated GBMs (MGMT methylation < 15%) compared to MGMT methylated ones (MGMT methylation ≥ 15%). Considering the large heterogeneity of lipid accumulation within the MGMT methylated GBMs, we further divided MGMT methylated ones into hypermethylated group (MGMT methylation ≥ 50%) and intermediate-methylated group (MGMT methylation 15∼50%), based on the significant different median survival of these two groups. It was found that the hypermethylated group showed remarkable differences in lipid accumulation compared to the other two groups, whereas no significant difference was shown between the intermediate-methylated and unmethylated groups, suggesting the strong correlation between MGMT hypermethylation and lipid accumulation. Based on the TCGA dataset, we found a significant increase in lipid oxidation and lipid efflux and a decrease in lipid synthesis in the unmethylated group, which might result in the reduction of lipid accumulation. These findings collectively unravel the altered lipid metabolism in GBM with low MGMT methylation, which may open up new opportunities for the diagnosis and treatment of TMZ-resistant GBM.
Results and Discussion
SRS Imaging and Raman Spectral Analysis of Intracellular Lipid Accumulation in MGMT Methylated and Unmethylated GBM
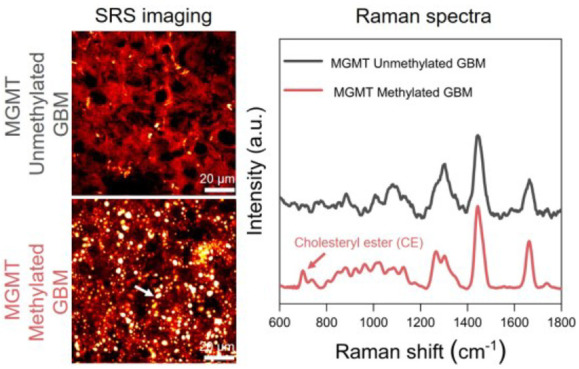
Based on label-free Raman spectromicroscopy, we performed a quantitative analysis of intracellular lipid accumulation in intact GBM tissues obtained from 36 patients undergone resection surgery. According to the current clinical practice, we grouped the GBMs into MGMT methylated GBMs (MGMT methylation ≥ 15%, n = 15) and MGMT unmethylated GBMs (MGMT methylation < 15%, n = 21). By tuning the laser beating frequency to be resonant with C–H stretching vibration at 2850 cm–1, strong SRS signals arose from the lipid-rich cell membranes and LDs, and in the meantime, weak signals were derived from the lipid-poor nuclei. Such an imaging contrast permits the clear visualization of cellular morphology and intracellular LDs in a label-free manner. As shown in Figure 1A,B, the SRS images provided morphological information similar to the hematoxylin and eosin (H&E) images of the adjacent tissue slices. More importantly, we revealed a substantial reduction in intracellular lipid accumulation in MGMT unmethylated GBM (patient no. 5) compared to the methylated one (patient no. 35; Figure 1B). Further composition analysis of individual LDs by confocal Raman spectroscopy identified high CE level, based on the distinctive Raman peaks for cholesterol ring around 702 cm–1 and ester bond around 1742 cm–1, in MGMT methylated GBM (patient no. 35) but not in MGMT unmethylated GBM (patient no. 5; Figure 1C). Meanwhile, since the distinctive Raman band peak at around 2883 cm–1 was found in saturated fat only (Figure S1), possibly originating from Fermi resonance or asymmetric vibration of CH2 in a straight and long acyl chain,22 we characterized the lipid saturation level by the height ratio (I2883/I2850). As shown in Figure 1C, the lipid saturation level looked a little bit more prominent in MGMT unmethylated GBM (patient no. 5) than the methylated one (patientn no. 35). Collectively, these findings unravel possible differences in lipid accumulation, including the LD amount and composition, between MGMT methylated and unmethylated GBMs.
Figure 1.
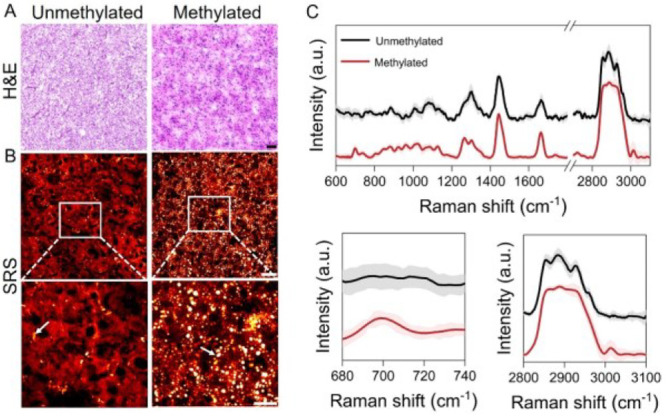
SRS imaging and Raman spectral analysis of lipid accumulation in methylated GBM (patient no. 35) and unmethylated GBM (patient no. 5). (A) H&E staining of the slices adjacent to the one for analysis by label-free Raman spectromicroscopy. Scale bar: 100 μm. (B) Representative SRS images of tissue slices from methylated GBM (patient no. 35) and unmethylated GBM (patient no. 5). Scale bar: 50 μm. Zoom-in images of the regions indicated by white boxes are shown in the bottom panel. LDs are indicated by white arrows. Scale bar: 20 μm. (C) Representative Raman spectra of LDs in GBM shown in (B). Spectral intensity was normalized by the CH2 bending band at 1442 cm–1. Shaded area indicates the standard deviation of Raman spectral measurements from different LDs in the same GBM tissue. In order to show the spectra more clearly, the spectra of unmethylated GBM (patient no. 5) were vertically shifted relative to methylated GBM (patient no. 35).
Quantitative Analysis of the Correlation between Intracellular Lipid Accumulation and MGMT Methylation in GBM
The LD amount, quantified in the way of LD area fraction, for MGMT unmethylated GBMs, was only about one-third of that for the MGMT methylated GBMs (Figure 2A,B and Table S1), suggesting a significant reduction in the lipid accumulation in MGMT unmethylated GBMs. According to the quantitative method for CE percentage in the LD reported previously,19,26 we took the Raman spectra of mixed emulsions containing different molar ratios of TG and CE (Figure S2A) and found that the molar percentage of CE (CE percentage) out of the total neutral lipids was linearly proportional to the height ratio between the most prominent cholesterol band at 702 cm–1 and the CH2 bending band at 1442 cm–1 (Figure S2B). According to this calibration curve, the CE percentage of LDs was significantly higher for MGMT methylated GBMs (42.73% ± 8.20%) compared to that for MGMT unmethylated GBMs (18.17% ± 2.51%; Figure 2C,D and Table S1). Considering that some LDs contained a high level of CEs while the others might not have detectable CEs, we also quantified the fraction of LDs with detectable CEs and the CE percentage within the LDs with detectable CEs, both of which significantly decreased in MGMT unmethylated GBMs relative to MGMT methylated ones (Figure S3). In addition, although some of the patients have a difference in lipid saturation level, no statistically significant difference was observed between MGMT methylated and unmethylated GBMs (Figure S4).
Figure 2.
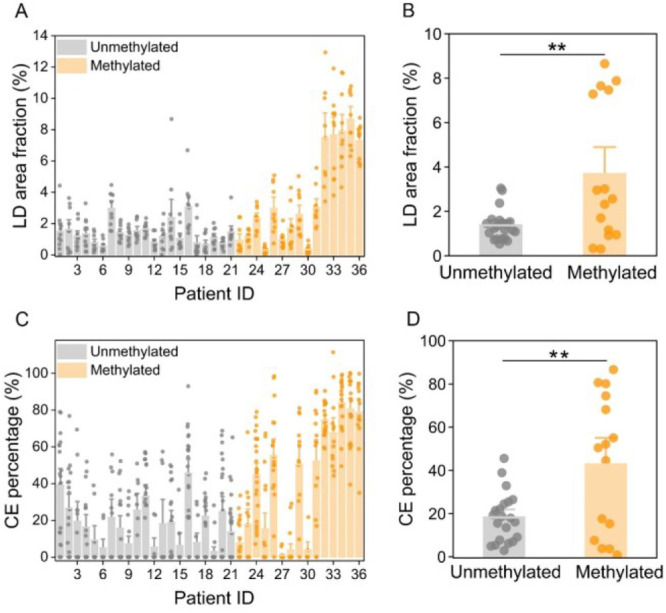
Quantitative analysis of the correlation between MGMT methylation and lipid accumulation in GBM. (A) LD area fraction derived from the SRS images in GBM tissues from 36 patients. (B) Average quantification of LD area fraction in (A) for unmethylated or methylated group. Each dot in (B) represents average LD area fraction for one patient. (C) Quantitation of CE percentage in GBM tissues from 36 patients. (D) Average quantification of CE percentage in (C) for unmethylated or methylated group. Each dot in (D) represents average CE percentage for one patient. Error bars represent SEM, n > 10. One-way ANOVA, *p < 0.05, **p < 0.005, ***p < 0.0005.
Notably, as shown in Figure 2B,D, there were clear clusters with high and low levels of LD amount or CE percentage in the MGMT methylated GBMs. For instance, some MGMT methylated GBMs did not show lipid accumulation as much as others did (Figure S5). This makes us speculate that the methylated population possibly has different subtypes. Based on The Cancer Genome Atlas (TCGA) dataset, we found a strong association between MGMT methylation and OS (p < 0.005, df = 1; Figure S6). Specifically, the GBMs with MGMT methylation ≥50% evidently has a longer median survival (21.1 months) than the ones with a MGMT methylation of 15∼50% (15.9 months) and the ones with a MGMT methylation <15% (12.5 months; p < 0.05, df = 1; Figure 3A). Accordingly, MGMT methylated GBMs were further divided into hypermethylated-methylated (MGMT methylation ≥ 50%) and intermediate-methylated (MGMT methylation 15∼50%) groups. As shown in Figure 3B, the LD amount was remarkably higher (>4.5-fold) in the hypermethylated group compared to the other two groups. CE percentage was 78.01% ± 3.13% in the hypermethylated group, which was also noticeably higher than that in the unmethylated group (18.17% ± 2.51%) and intermediate-methylated group (25.10% ± 7.15%; Figure 3C). The fraction of LDs with detectable CEs was also found to be distinctly increased (>2-fold) in the hypermethylated group compared to the other two groups (Figure S7). In addition, the level of lipid saturation was significantly reduced in the hypermethylated group compared to the other two groups (Figure 3D), suggesting a higher lipid unsaturation level in hypermethylated GBMs. Interestingly, no significant differences in lipid accumulation were found between the unmethylated and intermediate-methylated groups.
Figure 3.
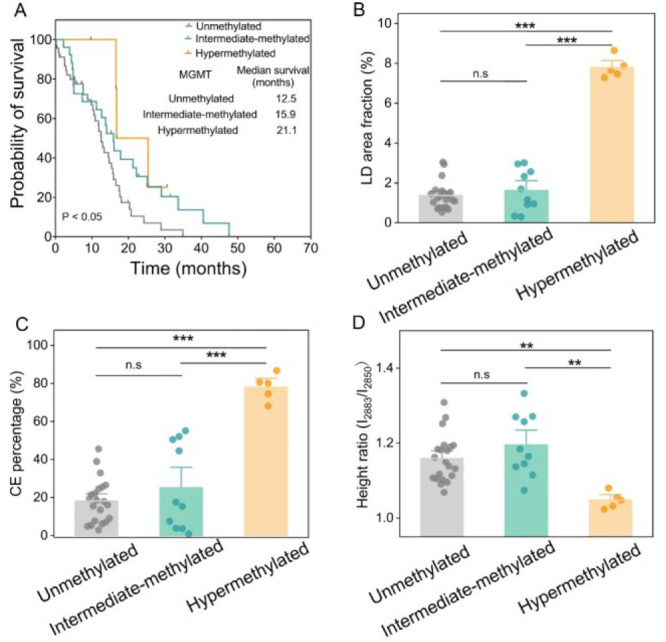
Quantitative analysis of lipid accumulation in GBM with different MGMT methylation. (A) OS of the patients in hypermethylated, intermediate-methylated, and unmethylated groups classified according to the median survival obtained from the TCGA dataset. Log-rank test p < 0.05, df = 1. LD area fraction (B), CE percentage (C), and height ratio (I2883/I2850) (D) in MGMT-hypermethylated, intermediate-methylated, and unmethylated groups. Each dot in (B) represents the average LD area fraction for one patient. Each dot in (C) represents the average CE percentage. Each dot in (D) represents the average height ratio (I2883/I2850) for one patient. Error bars represent SEM, n > 10. One-way ANOVA, *p < 0.05, **p < 0.005, ***p < 0.0005.
Previous studies have reported that TGs and CEs are prevalent in GBM and could be used as potential targets.12−14,27 On one hand, we confirmed intracellular neutral lipid accumulation in GBM. On the other hand, we unveiled that such abundant lipid accumulation only occurred in the MGMT methylated GBM and especially the hypermethylated GBM, a newly recognized subtype benefiting from TMZ treatment the most. This suggests that the GBM with low MGMT methylation needs an alternative metabolic vulnerability for treatment.
Profiling of the Gene Expression Associated with the Reduction of Intracellular Lipid Accumulation in GBM without MGMT Methylation
Although some studies showed the possible dysregulation of lipid metabolism in TMZ-resistance cell lines,28,29 the mechanism by which MGMT methylation affects lipid accumulation in GBM is unclear. Thus, we further explored the differential expression of lipid metabolism-related genes in hypermethylated, intermediate-methylated, and unmethylated groups, based on the TCGA dataset. The volcano plots displayed the differentially expressed genes (DEGs) in the three groups, and the common DEGs were then used for further functional analysis based on gene ontology (GO). ADTRP, which hydrolyzes bioactive fatty acid esters of hydroxy fatty acids,30 was downregulated in the hypermethylated group relative to the unmethylated group (Figure 4A). CYP4F2 and CYP4F3, which eliminate excessive fatty acids,31,32 were downregulated in the hypermethylated group relative to intermediate-methylated and unmethylated groups (Figure 4A,B). IL18, whose deficiency was previously shown to induce lipid accumulation,33 was downregulated in the hypermethylated group relative to the other two groups (Figure 4A,B). The de novo synthesis-related genes, such as MOGAT1 and G6PC, were upregulated in the hypermethylated group relative to the other two groups (Figure 4A,B). Collectively, these alterations of gene expression above led to the significant increase of lipid accumulation in the hypermethylated group compared to the other two groups.
Figure 4.
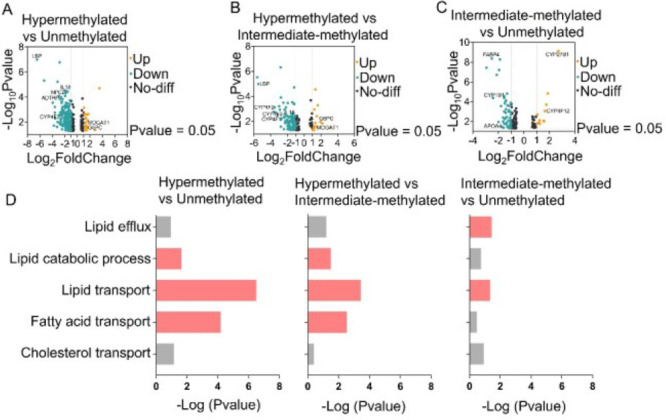
Analysis of lipid metabolism related gene expression in hypermethylated, intermediate-methylated, and unmethylated GBMs based on TCGA dataset. (A–C) Volcano plot of DEGs in hypermethylated vs unmethylated, hypermethylated vs intermediate-methylated, and intermediate-methylated vs unmethylated groups. DEGs were selected with thresholds of a fold change >2 and p < 0.05. (D) The common down-regulated pathways in hypermethylated vs unmethylated, hypermethylated vs intermediate-methylated, and intermediate-methylated vs unmethylated groups, obtained by GO enrichment analysis of DEGs. Red colors indicate a p value of less than 0.05, whereas gray colors indicate a p value greater than 0.05.
In addition, to compare the intermediate-methylated group with the unmethylated group, we found the following changes in gene expression related to lipid metabolism (Figure 4C). The lipid synthesis related gene CYP1B1 and fatty acid uptake-related gene FABP4 were downregulated, whereas the fatty acid oxidation-related gene CYP4F12 was upregulated in intermediate-methylated group. Meanwhile, the cholesterol efflux-related gene APOA4 was downregulated in the intermediate-methylated group. These results together suggest that the big variation in the lipid accumulation in the intermediate-methylated group might be due to the synergistic effect from changes in the lipid synthesis, lipid uptake, lipid oxidation, and lipid efflux.
Furthermore, the GO analysis showed the downregulation of pathways related to lipid efflux, lipid transport, lipid catabolic process, and upregulation of pathways related to neutral lipid biosynthesis in hypermethylated groups relative to the other two groups (Figures 4D and S8–10). Together, these finding provides possible clues underlying the link between MGMT methylation and lipid accumulation in GBM.
Conclusions
In summary, enabled by label-free Raman spectromicroscopy, we surprisingly found out that the intracellular lipid accumulation, which was previously considered as a potent therapeutic target for GBM, occurred only in MGMT methylated GBM (TMZ-sensitive), particularly in the newly recognized hypermethylated GBM, but not in MGMT unmethylated GBM (TMZ-resistant). Thus, neutral lipid accumulation is not universal for all GBM and is probably related to MGMT methylation, which suggests that unmethylated GBM may need an alternative metabolic target for treatment. Moreover, we revealed that the increase of lipid efflux and lipid oxidation and the decrease of lipid synthesis potentially contributed to the reduced lipid accumulation in the GBM with low MGMT methylation. Our study unravels the hidden relationship between MGMT methylation and lipid accumulation in GBM, which may offer new markers for the detection of TMZ drug resistance and new targets for the treatment of MGMT unmethylated GBM.
Acknowledgments
This work was supported by National Natural Science Foundation of China (No. 62027824), Fundamental Research Funds for the Central Universities (No. YWF-22-L-547), and The Capital Health Research and Development of Special (2022-2-2047).
Supporting Information Available
The Supporting Information is available free of charge at https://pubs.acs.org/doi/10.1021/acs.analchem.3c00967.
Information on the materials and methods, supplementary figures, and supplementary tables (PDF)
Author Contributions
§ These authors contributed equally to this work.
Author Contributions
N.W. conducted the SRS image acquisition, Raman spectrum acquisition, and data analysis. J.W conducted tissue preparation and participated in SRS imaging acquisition and Raman spectrum acquisition. P.W., S.Y., and N.J. were responsible for experimental design. N.W. wrote the manuscript. S.Y. and N.J. wrote and edited the manuscript. All authors contributed to the study and critically reviewed the manuscript.
The authors declare no competing financial interest.
Supplementary Material
References
- Uddin M. S.; Mamun A. A.; Alghamdi B. S.; Tewari D.; Jeandet P.; Sarwar M. S.; Ashraf G. M. Epigenetics of Glioblastoma Multiforme: From Molecular Mechanisms to Therapeutic Approaches. Semin. Cancer. Biol. 2022, 83, 100–120. 10.1016/j.semcancer.2020.12.015. [DOI] [PubMed] [Google Scholar]
- Weller M.; van den Bent M.; Hopkins K.; Tonn J. C.; Stupp R.; Falini A.; Cohen-Jonathan-Moyal E.; Frappaz D.; Henriksson R.; Balana C.; Chinot O.; Ram Z.; Reifenberger G.; Soffietti R.; Wick W. European Association for Neuro-Oncology (EANO) Task Force on Malignant Glioma. EANO Guideline for the Diagnosis and Treatment of Anaplastic Gliomas and Glioblastoma. Lancet. Oncol. 2014, 15 (9), e395–403. 10.1016/S1470-2045(14)70011-7. [DOI] [PubMed] [Google Scholar]
- Fisher J. P.; Adamson D. C. Current FDA-Approved Therapies for High-Grade Malignant Gliomas. Biomedicines 2021, 9 (3), 324. 10.3390/biomedicines9030324. [DOI] [PMC free article] [PubMed] [Google Scholar]
- Mirimanoff R. O.; Gorlia T.; Mason W.; VandenBent M. J.; Kortmann R. D.; Fisher B.; Reni M.; Brandes A. A.; Curschmann J.; Villa S.; Cairncross G.; Allgeier A.; Lacombe D.; Stupp R. l. Radiotherapy and Temozolomide for Newly Diagnosed Glioblastoma: Recursive Partitioning Analysis of the EORTC 26981/22981-NCIC CE3 Phase III Randomized Trial. Journal of Clinical Oncology. 2006, 24, 2563–2569. 10.1200/JCO.2005.04.5963. [DOI] [PubMed] [Google Scholar]
- Tomar M. S.; Kumar A.; Srivastava C.; Shrivastava A. Elucidating the Mechanisms of Temozolomide Resistance in Gliomas and the Strategies to Overcome the Resistance. Biochim. Biophys. Acta. Rev. Cancer. 2021, 1876 (2), 188616. 10.1016/j.bbcan.2021.188616. [DOI] [PubMed] [Google Scholar]
- Zhang J.; Stevens M. F. G.; Bradshaw T. D. Temozolomide: Mechanisms of Action, Repair and Resistance. Curr. Mol. Pharmacol. 2012, 5 (1), 102–114. 10.2174/1874467211205010102. [DOI] [PubMed] [Google Scholar]
- Wu S.; Li X.; Gao F.; de Groot J. F.; Koul D.; Yung W. K. A. PARP-Mediated PARylation of MGMT is Critical to Promote Repair of Temozolomide-Induced O6-Methylguanine DNA Damage in Glioblastoma. Neuro. Oncol. 2021, 23 (6), 920–931. 10.1093/neuonc/noab003. [DOI] [PMC free article] [PubMed] [Google Scholar]
- Wick W.; Weller M.; van den Bent M.; Sanson M.; Weiler M.; von Deimling A.; Plass C.; Hegi M.; Platten M.; Reifenberger G. MGMT Testing-the Challenges for Biomarker-Based Glioma Treatment. Nat. Rev. Neurol. 2014, 10 (7), 372–385. 10.1038/nrneurol.2014.100. [DOI] [PubMed] [Google Scholar]
- Snaebjornsson M. T.; Janaki-Raman S.; Schulze A. Greasing the Wheels of the Cancer Machine: The Role of Lipid Metabolism in Cancer. Cell. Metab. 2020, 31 (1), 62–76. 10.1016/j.cmet.2019.11.010. [DOI] [PubMed] [Google Scholar]
- Santos C. R.; Schulze A. Lipid Metabolism in Cancer. FEBS. J. 2012, 279 (15), 2610–2623. 10.1111/j.1742-4658.2012.08644.x. [DOI] [PubMed] [Google Scholar]
- Cruz A. L. S.; Barreto E. A.; Fazolini N. P. B.; Viola J. P. B.; Bozza P. T. Lipid Droplets: Platforms with Multiple Functions in Cancer Hallmarks. Cell. Death. Dis. 2020, 11 (2), 105. 10.1038/s41419-020-2297-3. [DOI] [PMC free article] [PubMed] [Google Scholar]
- Geng F.; Cheng X.; Wu X.; Yoo J. Y.; Cheng C.; Guo J. Y.; Mo X.; Ru P.; Hurwitz B.; Kim S. H.; Otero J.; Puduvalli V.; Lefai E.; Ma J.; Nakano I.; Horbinski C.; Kaur B.; Chakravarti A.; Guo D. Inhibition of SOAT1 Suppresses Glioblastoma Growth via Blocking SREBP-1-Mediated Lipogenesis. Clin. Cancer. Res. 2016, 22 (21), 5337–5348. 10.1158/1078-0432.CCR-15-2973. [DOI] [PMC free article] [PubMed] [Google Scholar]
- Cheng X.; Geng F.; Pan M.; Wu X.; Zhong Y.; Wang C.; Tian Z.; Cheng C.; Zhang R.; Puduvalli V.; Horbinski C.; Mo X.; Han X.; Chakravarti A.; Guo D. Targeting DGAT1 Ameliorates Glioblastoma by Increasing Fat Catabolism and Oxidative Stress. Cell Metab. 2020, 32 (2), 229–242.e8. 10.1016/j.cmet.2020.06.002. [DOI] [PMC free article] [PubMed] [Google Scholar]
- Guo D.; Reinitz F.; Youssef M.; Hong C.; Nathanson D.; Akhavan D.; Kuga D.; Amzajerdi A. N.; Soto H.; Zhu S.; Babic I.; Tanaka K.; Dang J.; Iwanami A.; Gini B.; Dejesus J.; Lisiero D. D.; Huang T. T.; Prins R. M.; Wen P. Y.; Robins H. I.; Prados M. D.; Deangelis L. M.; Mellinghoff I. K.; Mehta M. P.; James C. D.; Chakravarti A.; Cloughesy T. F.; Tontonoz P.; Mischel P. S. an LXR Agonist Promotes Glioblastoma Cell Death Through Inhibition of an EGFR/AKT/SREBP-1/LDLR-Dependent Pathway. Cancer Discovery 2011, 1 (5), 442–456. 10.1158/2159-8290.CD-11-0102. [DOI] [PMC free article] [PubMed] [Google Scholar]
- Cheng J. X.; Xie X. S. Vibrational Spectroscopic Imaging of Living Systems: an Emerging Platform for Biology and Medicine. Science. 2015, 350 (6264), aaa8870. 10.1126/science.aaa8870. [DOI] [PubMed] [Google Scholar]
- Yue S.; Cheng J. X. Deciphering Single Cell Metabolism by Coherent Raman Scattering Microscopy. Curr. Opin. Chem. Biol. 2016, 33, 46–57. 10.1016/j.cbpa.2016.05.016. [DOI] [PMC free article] [PubMed] [Google Scholar]
- Chen T.; Yavuz A.; Wang M. C. Dissecting Lipid Droplet Biology with Coherent Raman Scattering Microscopy. J. Cell. Sci. 2022, 135 (5), jcs252353. 10.1242/jcs.252353. [DOI] [PMC free article] [PubMed] [Google Scholar]
- Slipchenko M. N.; Le T. T.; Chen H.; Cheng J. X. High-Speed Vibrational Imaging and Spectral Analysis of Lipid Bodies by Compound Raman Microscopy. J. Phys. Chem. B 2009, 113 (21), 7681–7686. 10.1021/jp902231y. [DOI] [PMC free article] [PubMed] [Google Scholar]
- Yue S.; Li J.; Lee S. Y.; Lee H. J.; Shao T.; Song B.; Cheng L.; Masterson T. A.; Liu X.; Ratliff T. L.; Cheng J. X. Cholesteryl Ester Accumulation Induced by PTEN Loss and PI3K/AKT Activation Underlies Human Prostate Cancer Aggressiveness. Cell. Metab. 2014, 19 (3), 393–406. 10.1016/j.cmet.2014.01.019. [DOI] [PMC free article] [PubMed] [Google Scholar]
- Li J.; Gu D.; Lee S. S.; Song B.; Bandyopadhyay S.; Chen S.; Konieczny S. F.; Ratliff T. L.; Liu X.; Xie J.; Cheng J. X. Abrogating Cholesterol Esterification Suppresses Growth and Metastasis of Pancreatic Cancer. Oncogene. 2016, 35 (50), 6378–6388. 10.1038/onc.2016.168. [DOI] [PMC free article] [PubMed] [Google Scholar]
- Li J.; Condello S.; Thomes-Pepin J.; Ma X.; Xia Y.; Hurley T. D.; Matei D.; Cheng J. X. Lipid Desaturation is a Metabolic Marker and Therapeutic Target of Ovarian Cancer Stem Cells. Cell. Stem. Cell. 2017, 20 (3), 303–314.e5. 10.1016/j.stem.2016.11.004. [DOI] [PMC free article] [PubMed] [Google Scholar]
- Yan S.; Cui S.; Ke K.; Zhao B.; Liu X.; Yue S.; Wang P. Hyperspectral Stimulated Raman Scattering Microscopy Unravels Aberrant Accumulation of Saturated Fat in Human Liver Cancer. Anal. Chem. 2018, 90 (11), 6362–6366. 10.1021/acs.analchem.8b01312. [DOI] [PubMed] [Google Scholar]
- Du J.; Su Y.; Qian C.; Yuan D.; Miao K.; Lee D.; Ng A. H. C.; Wijker R. S.; Ribas A.; Levine R. D.; Heath J. R.; Wei L. Raman-Guided Subcellular Pharmaco-Metabolomics for Metastatic Melanoma Cells. Nat. Commun. 2020, 11 (1), 4830. 10.1038/s41467-020-18376-x. [DOI] [PMC free article] [PubMed] [Google Scholar]
- Lee H. J.; Chen Z.; Collard M.; Chen F.; Chen J. G.; Wu M.; Alani R. M.; Cheng J. X. Multimodal Metabolic Imaging Reveals Pigment Reduction and Lipid Accumulation in Metastatic Melanoma. BME. Front. 2021, 2021, 9860123. 10.34133/2021/9860123. [DOI] [PMC free article] [PubMed] [Google Scholar]
- Tan Y.; Li J.; Zhao G.; Huang K. C.; Cardenas H.; Wang Y.; Matei D.; Cheng J. X. Metabolic Reprogramming from Glycolysis to Fatty Acid Uptake and Beta-Oxidation in Platinum-Resistant Cancer Cells. Nat. Commun. 2022, 13 (1), 4554. 10.1038/s41467-022-32101-w. [DOI] [PMC free article] [PubMed] [Google Scholar]
- Wang P.; Li J.; Wang P.; Hu C. R.; Zhang D.; Sturek M.; Cheng J. X. Label-Free Quantitative Imaging of Cholesterol in Intact Tissues by Hyperspectral Stimulated Raman Scattering Microscopy. Angew. Chem., Int. Ed. 2013, 52 (49), 13042–13046. 10.1002/anie.201306234. [DOI] [PMC free article] [PubMed] [Google Scholar]
- Wu X.; Geng F.; Cheng X.; Guo Q.; Zhong Y.; Cloughesy T. F.; Yong W. H.; Chakravarti A.; Guo D. Lipid Droplets Maintain Energy Homeostasis and Glioblastoma Growth via Autophagic Release of Stored Fatty Acids. iScience 2020, 23 (10), 101569. 10.1016/j.isci.2020.101569. [DOI] [PMC free article] [PubMed] [Google Scholar]
- Tiek D. M.; Rone J. D.; Graham G. T.; Pannkuk E. L.; Haddad B. R.; Riggins R. B. Alterations in Cell Motility, Proliferation, and Metabolism in Novel Models of Acquired Temozolomide Resistant Glioblastoma. Sci. Rep. 2018, 8 (1), 7222. 10.1038/s41598-018-25588-1. [DOI] [PMC free article] [PubMed] [Google Scholar]
- Nam H. J.; Kim Y. E.; Moon B. S.; Kim H. Y.; Jung D.; Choi S.; Jang J. W.; Nam D. H.; Cho H. Azathioprine Antagonizes Aberrantly Elevated Lipid Metabolism and Induces Apoptosis in Glioblastoma. iScience 2021, 24 (3), 102238. 10.1016/j.isci.2021.102238. [DOI] [PMC free article] [PubMed] [Google Scholar]
- Parsons W. H.; Kolar M. J.; Kamat S. S.; Cognetta A. B. III; Hulce J. J.; Saez E.; Kahn B. B.; Saghatelian A.; Cravatt B. F. AIG1 and ADTRP are Atypical Integral Membrane Hydrolases that Degrade Bioactive FAHFAs. Nat. Chem. Biol. 2016, 12 (5), 367–372. 10.1038/nchembio.2051. [DOI] [PMC free article] [PubMed] [Google Scholar]
- Gasparrini M.; Giampieri F.; Alvarez Suarez J. M.; Mazzoni L.; Forbes Hernandez T. Y.; Quiles J. L.; Bullon P.; Battino M. AMPK as a New Attractive Therapeutic Target for Disease Prevention: The Role of Dietary Compounds AMPK and Disease Prevention. Curr. Drug Targets 2016, 17 (8), 865–889. 10.2174/1573399811666150615150235. [DOI] [PubMed] [Google Scholar]
- Wanders R. J.; Komen J.; Kemp S. Fatty acid Omega-Oxidation as a Rescue Pathway for Fatty Acid Oxidation Disorders in Humans. FEBS. J. 2011, 278 (2), 182–194. 10.1111/j.1742-4658.2010.07947.x. [DOI] [PubMed] [Google Scholar]
- Netea M. G.; Joosten L. A.; Lewis E.; Jensen D. R.; Voshol P. J.; Kullberg B. J.; Tack C. J.; van Krieken H.; Kim S. H.; Stalenhoef A. F.; van de Loo F. A.; Verschueren I.; Pulawa L.; Akira S.; Eckel R. H.; Dinarello C. A.; van den Berg W.; van der Meer J. W. Deficiency of Interleukin-18 in Mice Leads to Hyperphagia, Obesity and Insulin Resistance. Nat. Med. 2006, 12 (6), 650–656. 10.1038/nm1415. [DOI] [PubMed] [Google Scholar]
Associated Data
This section collects any data citations, data availability statements, or supplementary materials included in this article.