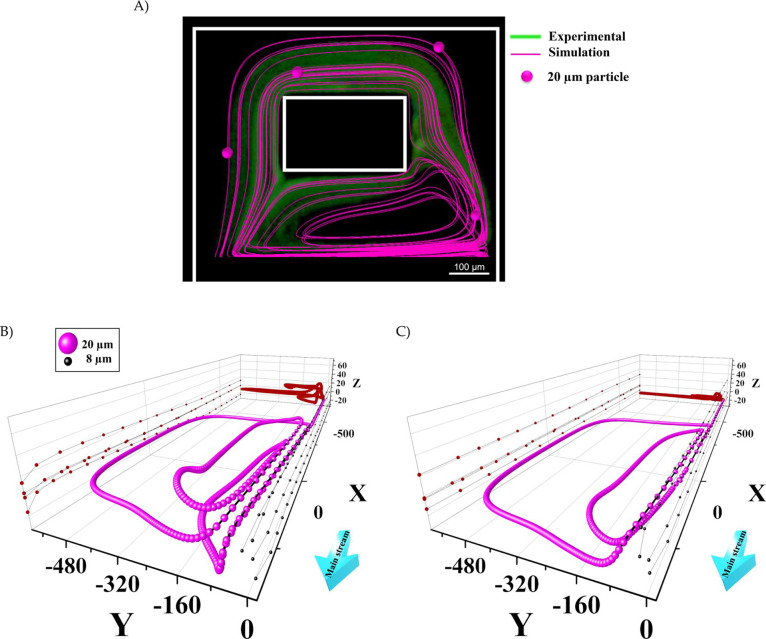
Figure 3.
(A) Validation of particle tracing using numerical simulation (pink lines) compared with the green fluorescent image of vortices carrying 20 μm fluorescent beads at a flow rate of 375 μL/min (0.4 s into simulation). (B) The 3D trajectories of a single 20 μm trapped particle after multiple rounds of orbiting in the vortices (depicted in pink) and those of four represented 8 μm microparticles passing straight through the chamber (depicted in black) are shown for ECR versus (C) CHC. The yz projections of 20 μm particle trajectories (highlighted in red) were plotted to compare vortex formation between the two chips. The flow rates for the constant and elevated height chips are 525 and 375 μL/min, respectively.

