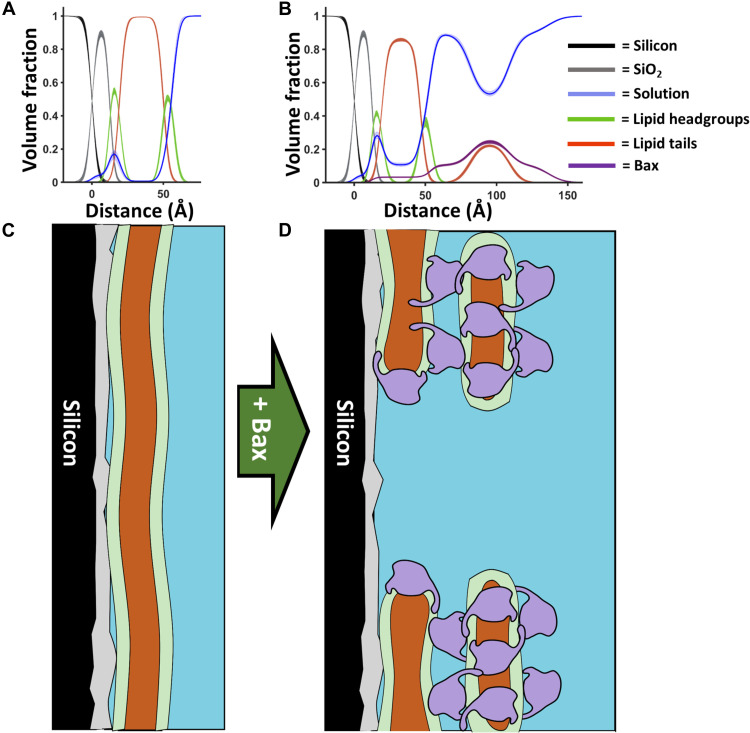
Fig. 2. A model for Bax pore formation.
Component volume fraction profiles from before (A) and after (B) the interaction of Bax with mitochondrial model membranes (in this case, d-Bax to a 90 mol % POPC–10 mol % TOCL SLB; see fig. S3). Below these are schematics (C and D) of how this component distribution in the Z direction may relate to the protein and lipid distributions across the surface before and after Bax interaction. The distribution of Bax across the membrane (D) is shown as a representation of how many layers of this protein, depicted as the envelope of its structure dimensions (8), can be distributed across the porated membrane based on NR results. This model comes from consideration of the data presented here and in previous SLB studies using atomic force microscopy (17).

