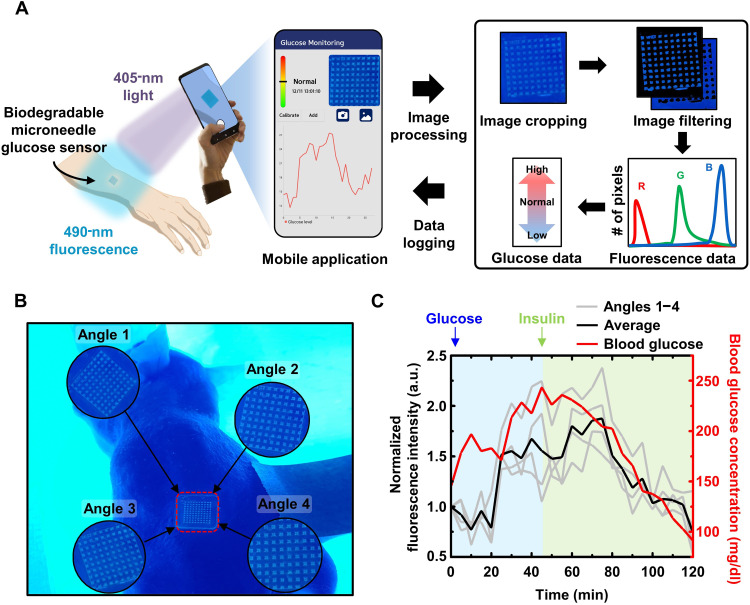
Fig. 5. Operation of the user-friendly home diagnosis system.
(A) Overview of the home diagnosis glucose system. (B and C) Fluorescence images and graphs of the results of the microneedle glucose sensor obtained using the mobile application at various angles (black, mean value of the fluorescence intensity results from four angles; gray, fluorescence intensity results from four angles; red, glucose concentration measured by the glucometer). a.u., arbitrary units.

