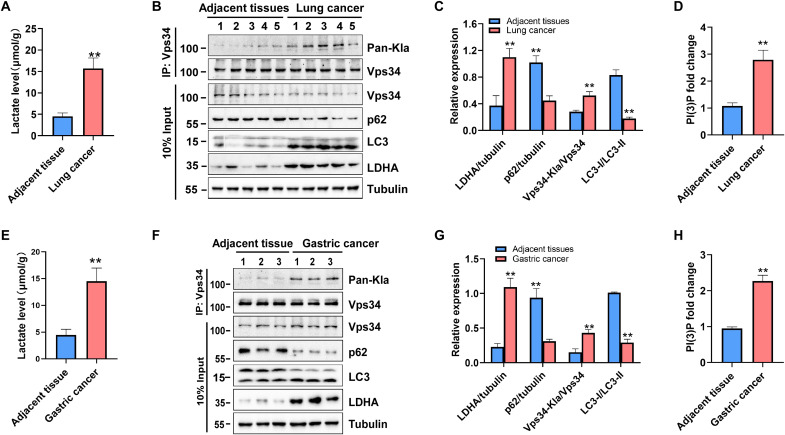
Fig. 8. Vps34 lactylation correlates with cancer progress.
(A) Lactate level in lung cancer and adjacent tissues. Data are shown as means ± SD; **P < 0.01, n = 5. (B) Vps34 lactylation level and autophagy flux in lung cancer and adjacent tissues. Tissues were lysed by TAP buffer, Vps34 was purified by immunoprecipitation, and protein level was analyzed by Western blot. (C) Quantification of Western blot in (B). Data are shown as means ± SD; **P < 0.01, n = 5. (D) The PI(3)P fold change in in lung cancer and adjacent tissues. Vps34 was purified by immunoprecipitation, in vitro Vps34 kinase assay was performed, and PI(3)P level was determined by the PI(3)P ELISA kit. Data are shown as means ± SD; **P < 0.01, n = 5. (E) Lactate level in gastric cancer and adjacent tissues. Data are shown as means ± SD; **P < 0.01, n = 3. (F) Vps34 lactylation level and autophagy flux in gastric cancer and adjacent tissues. Methods as K. (G) Quantification of Western blot in (F). Data are shown as means ± SD; **P < 0.01, n = 3. (H) The PI(3)P fold change in gastric cancer and adjacent tissues. Data are shown as means ± SD; **P < 0.01, n = 3.

